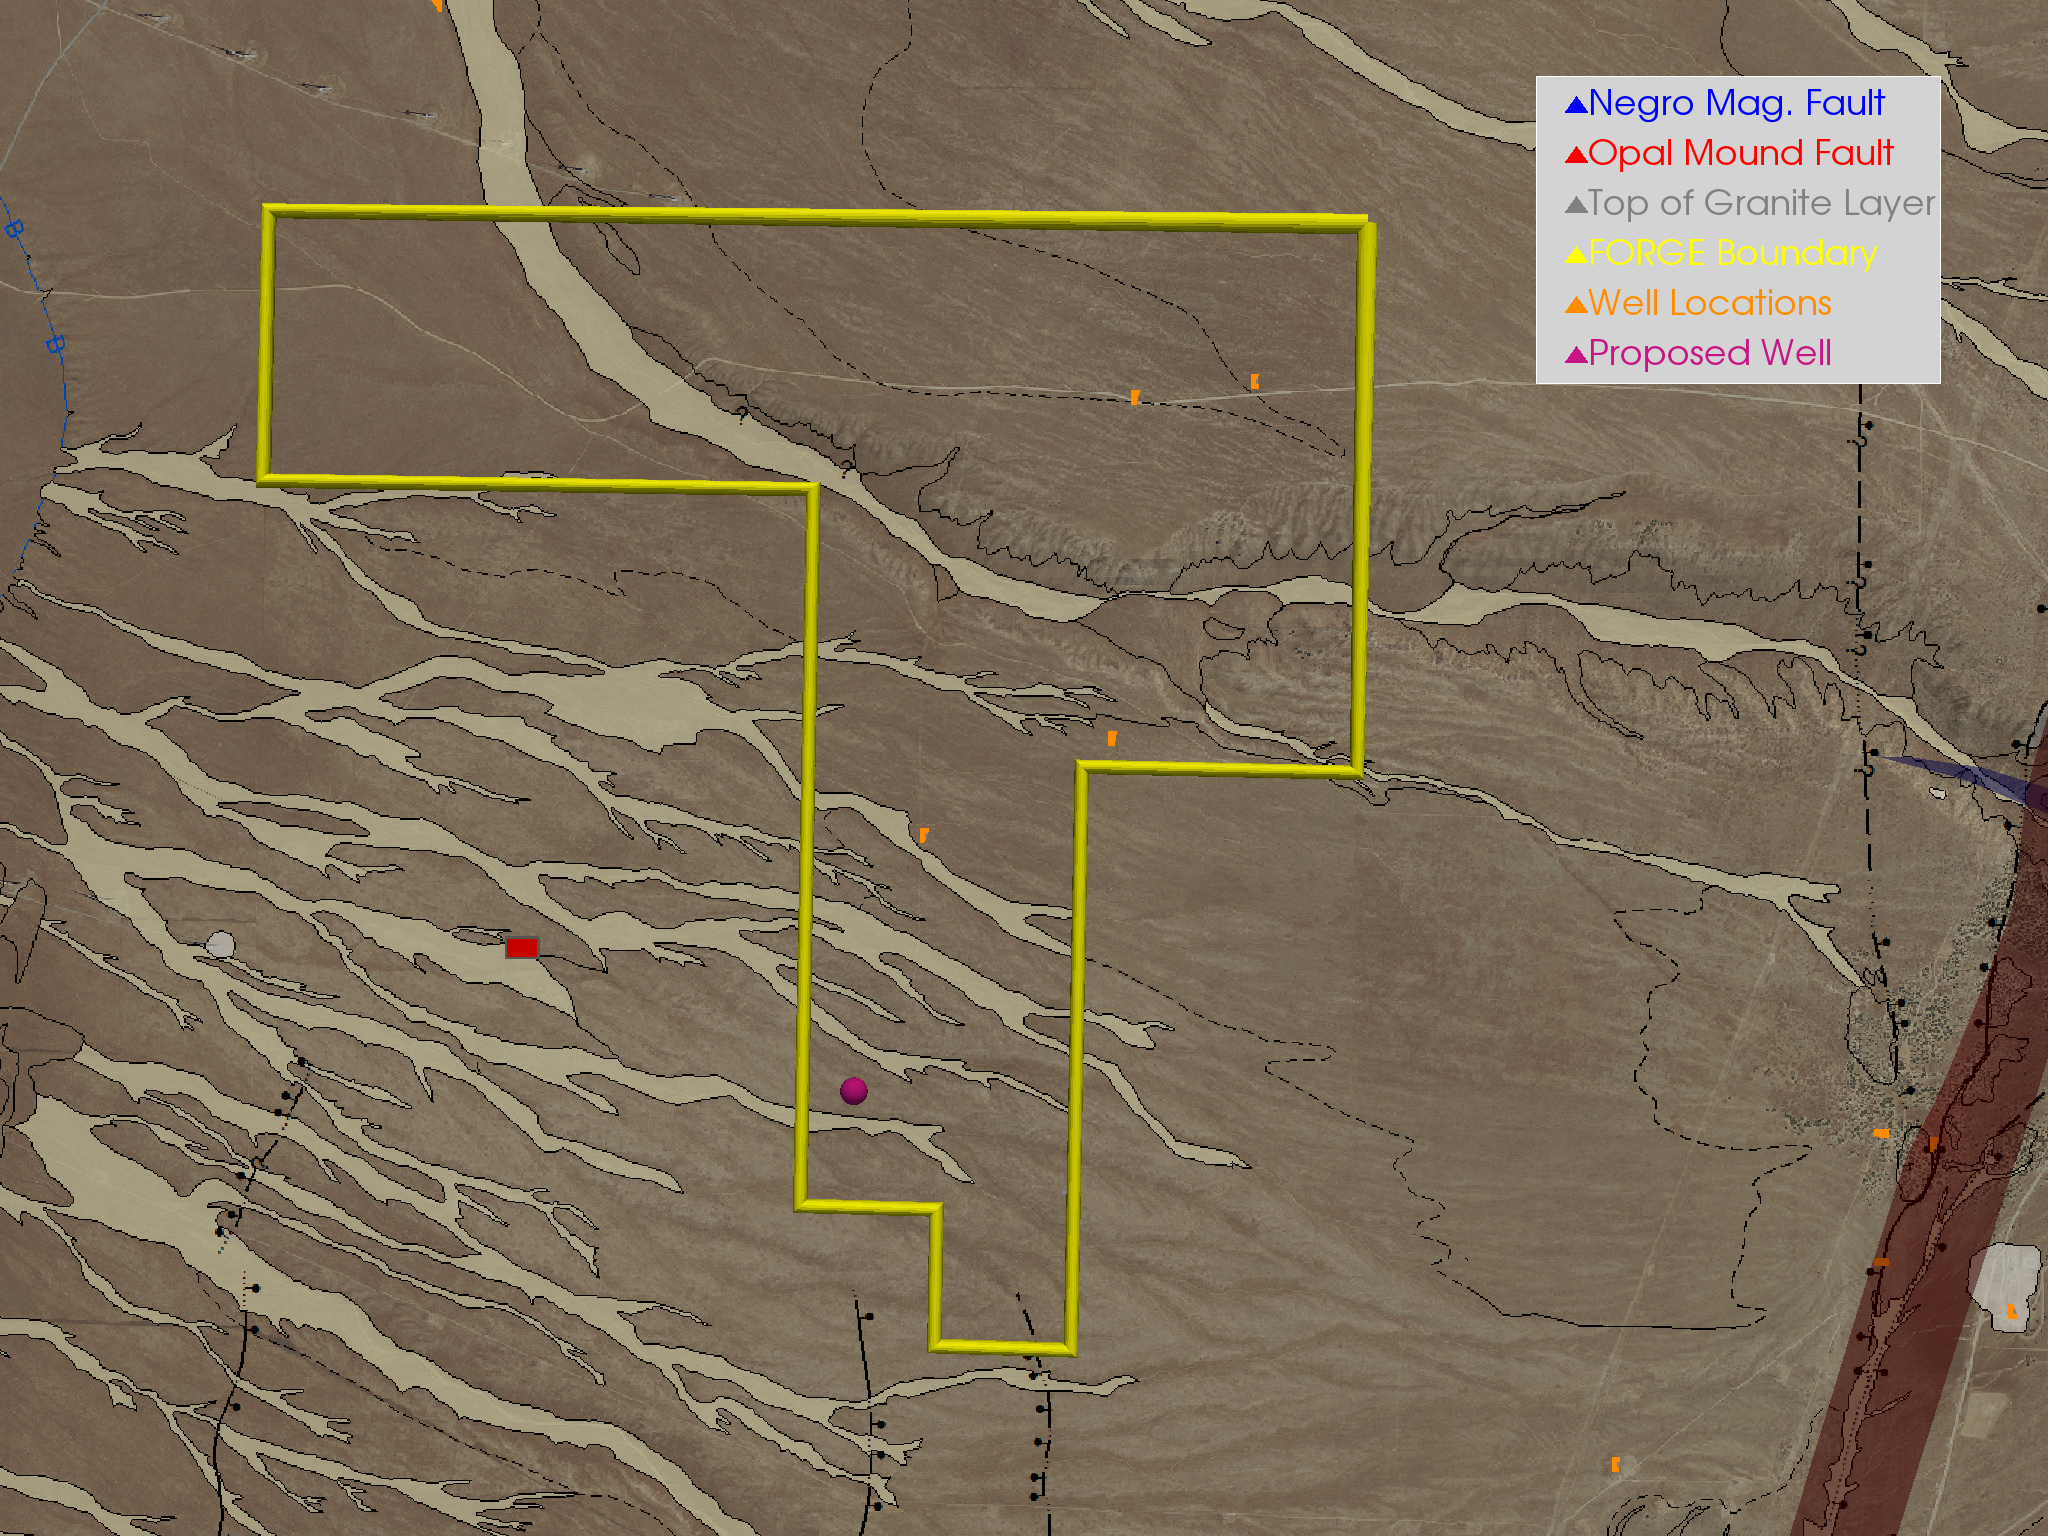
Static Portfolio
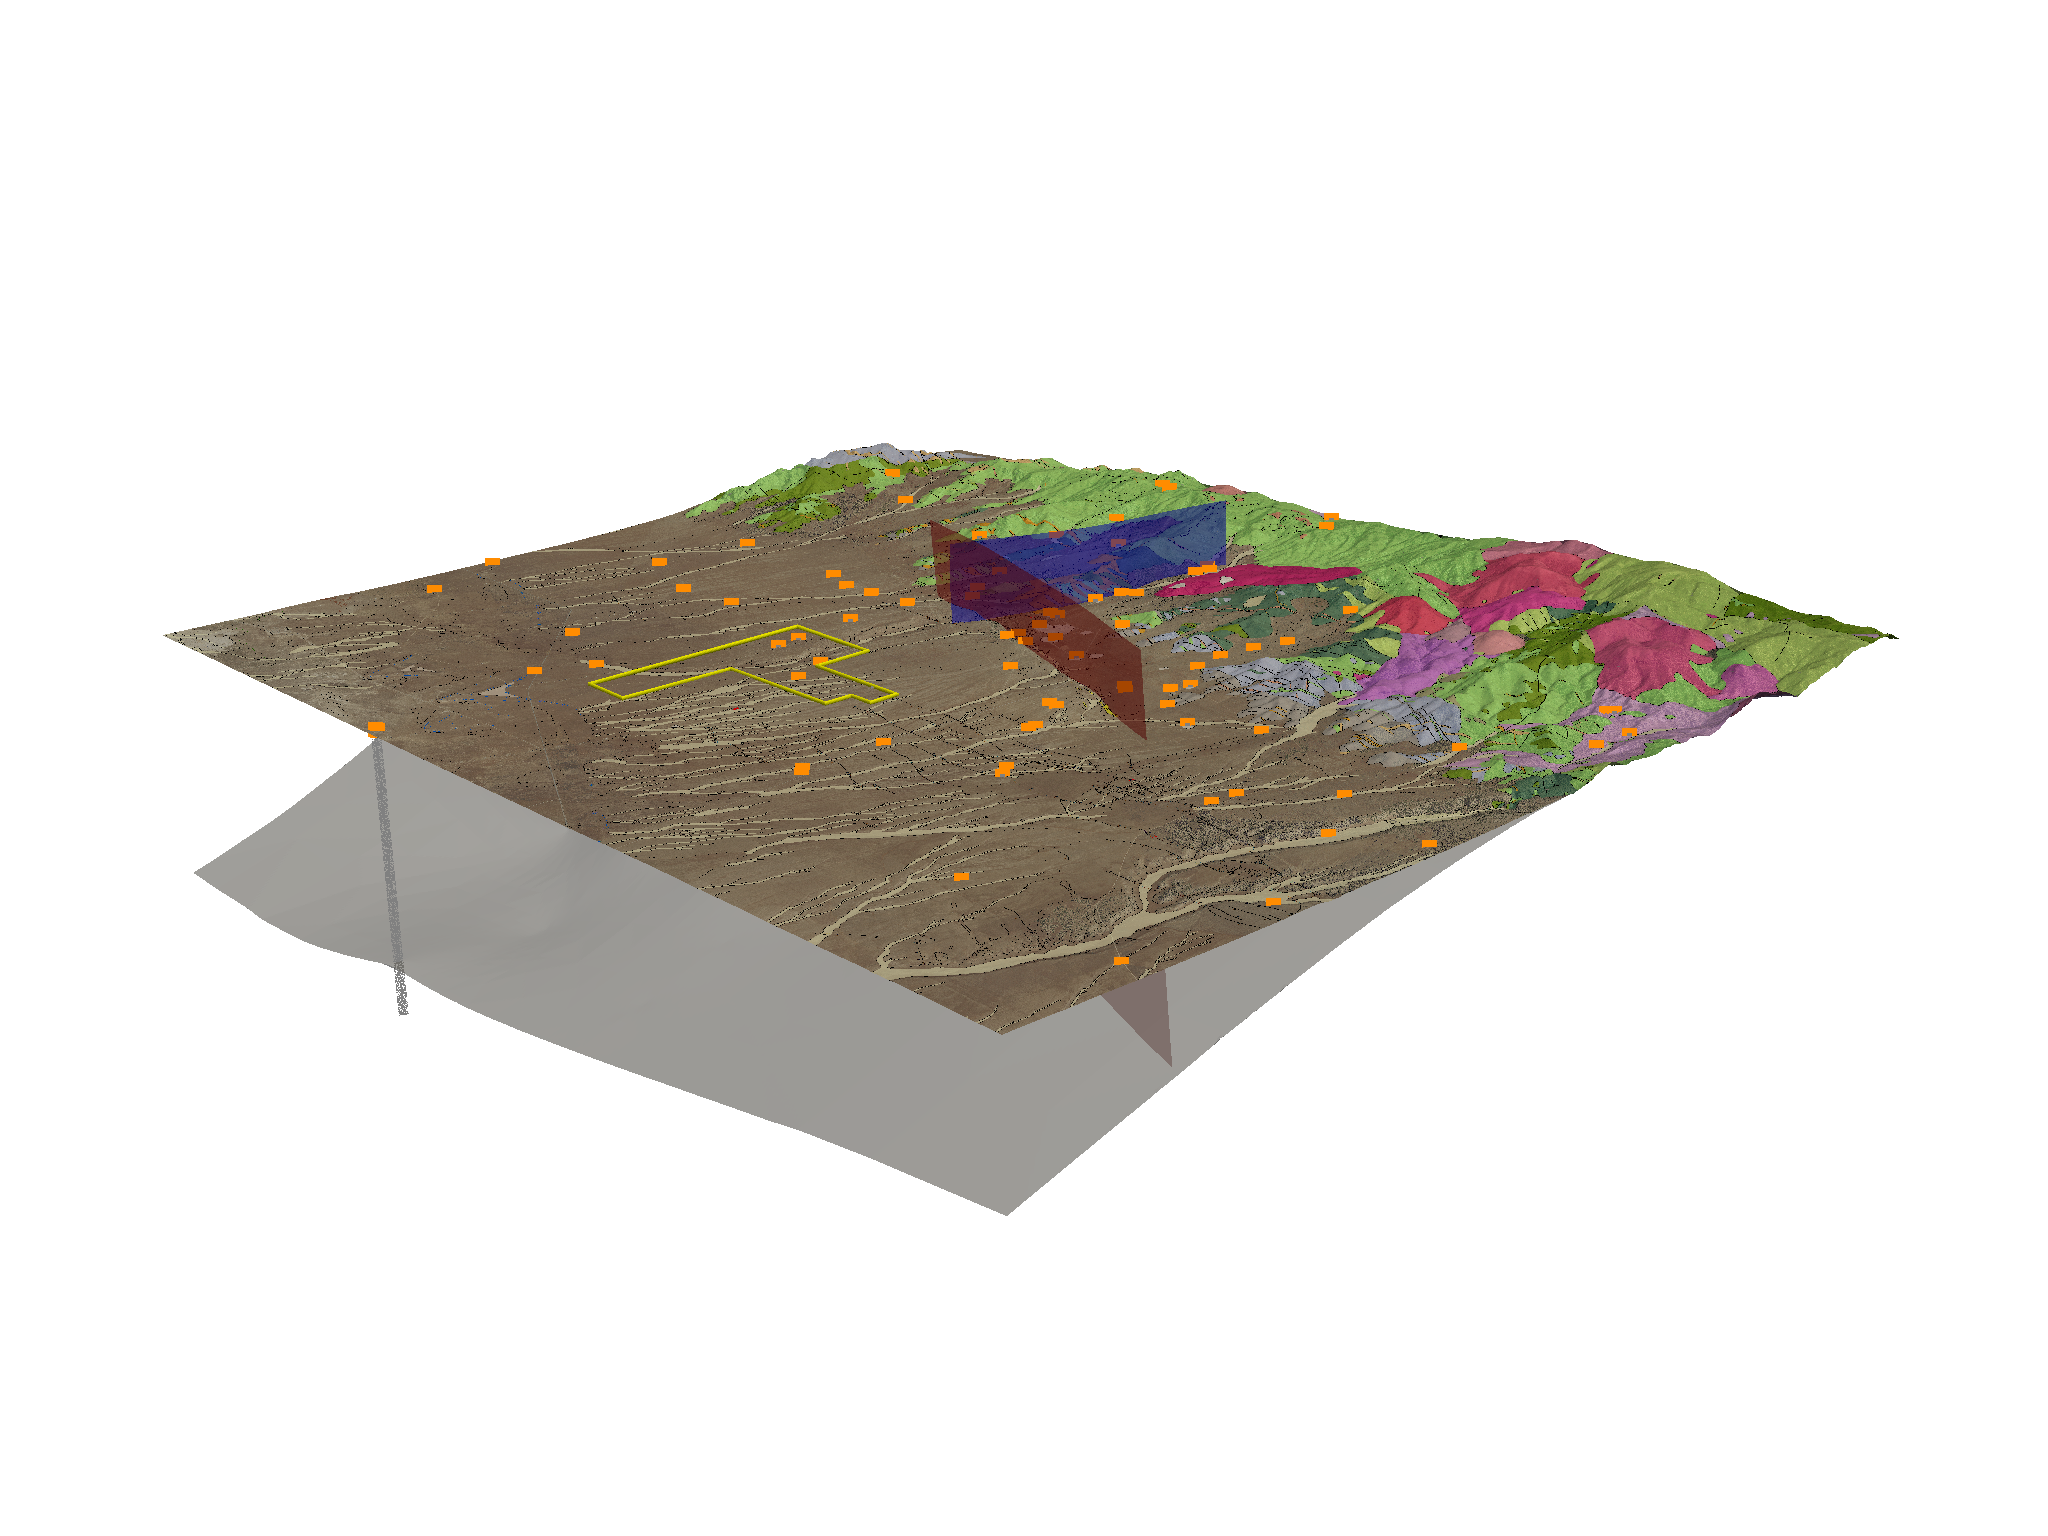
Figure 2
Regional subsurface view showing temperature model threshold between 175ºC and 225ºC paired with Gamma Ray Well Logs.
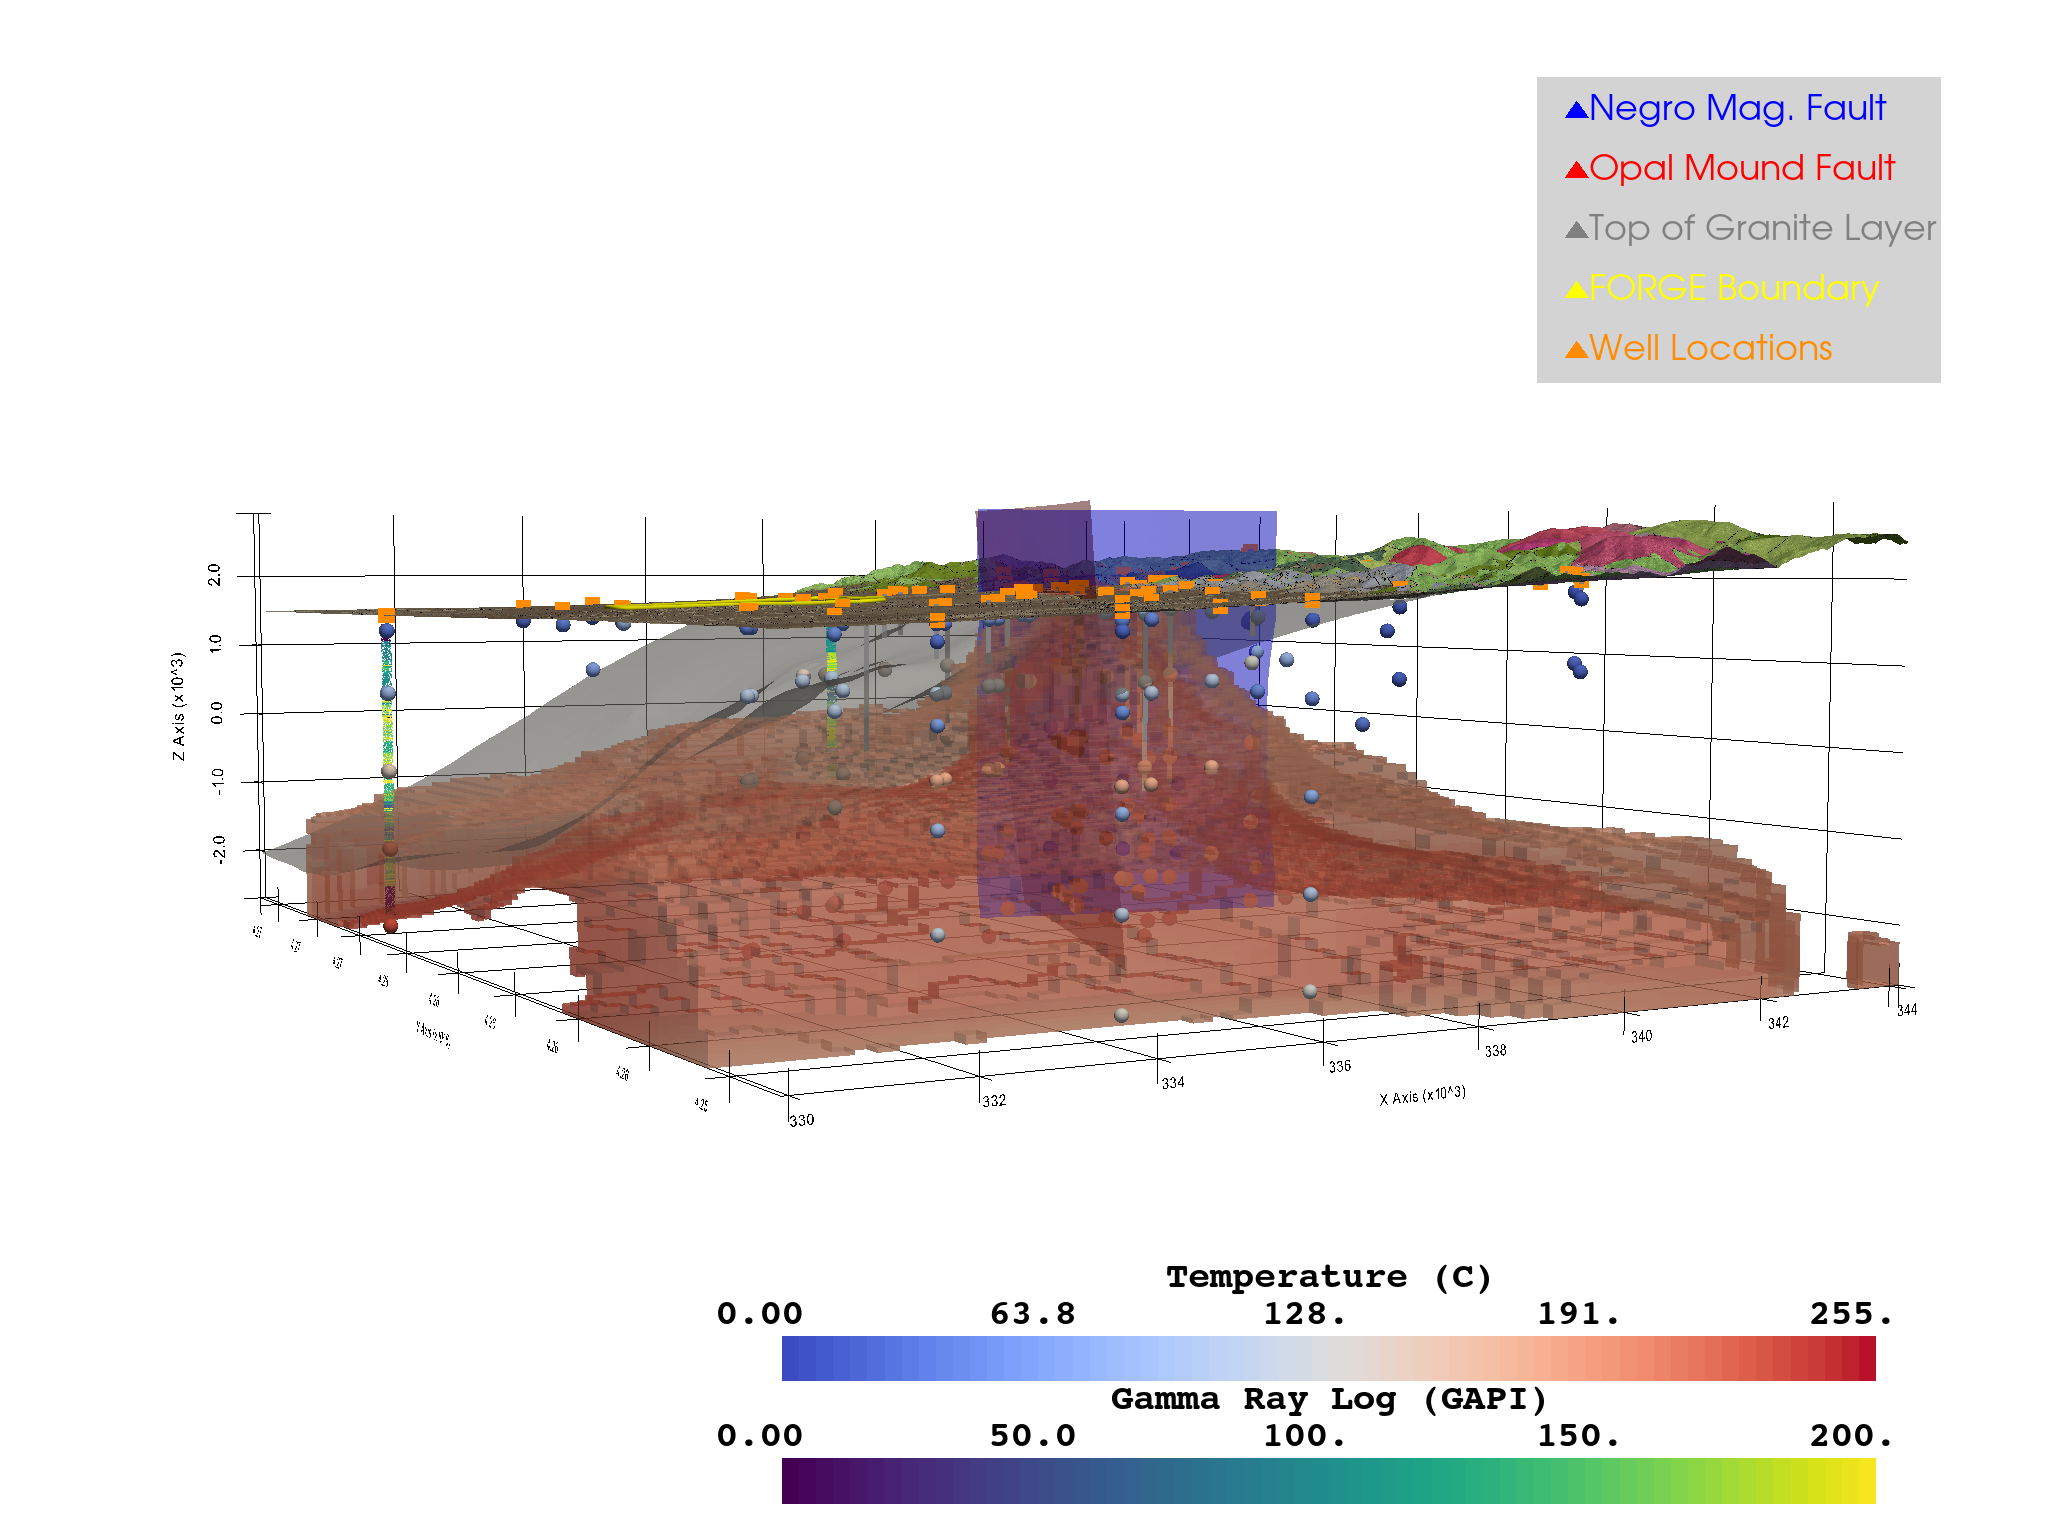
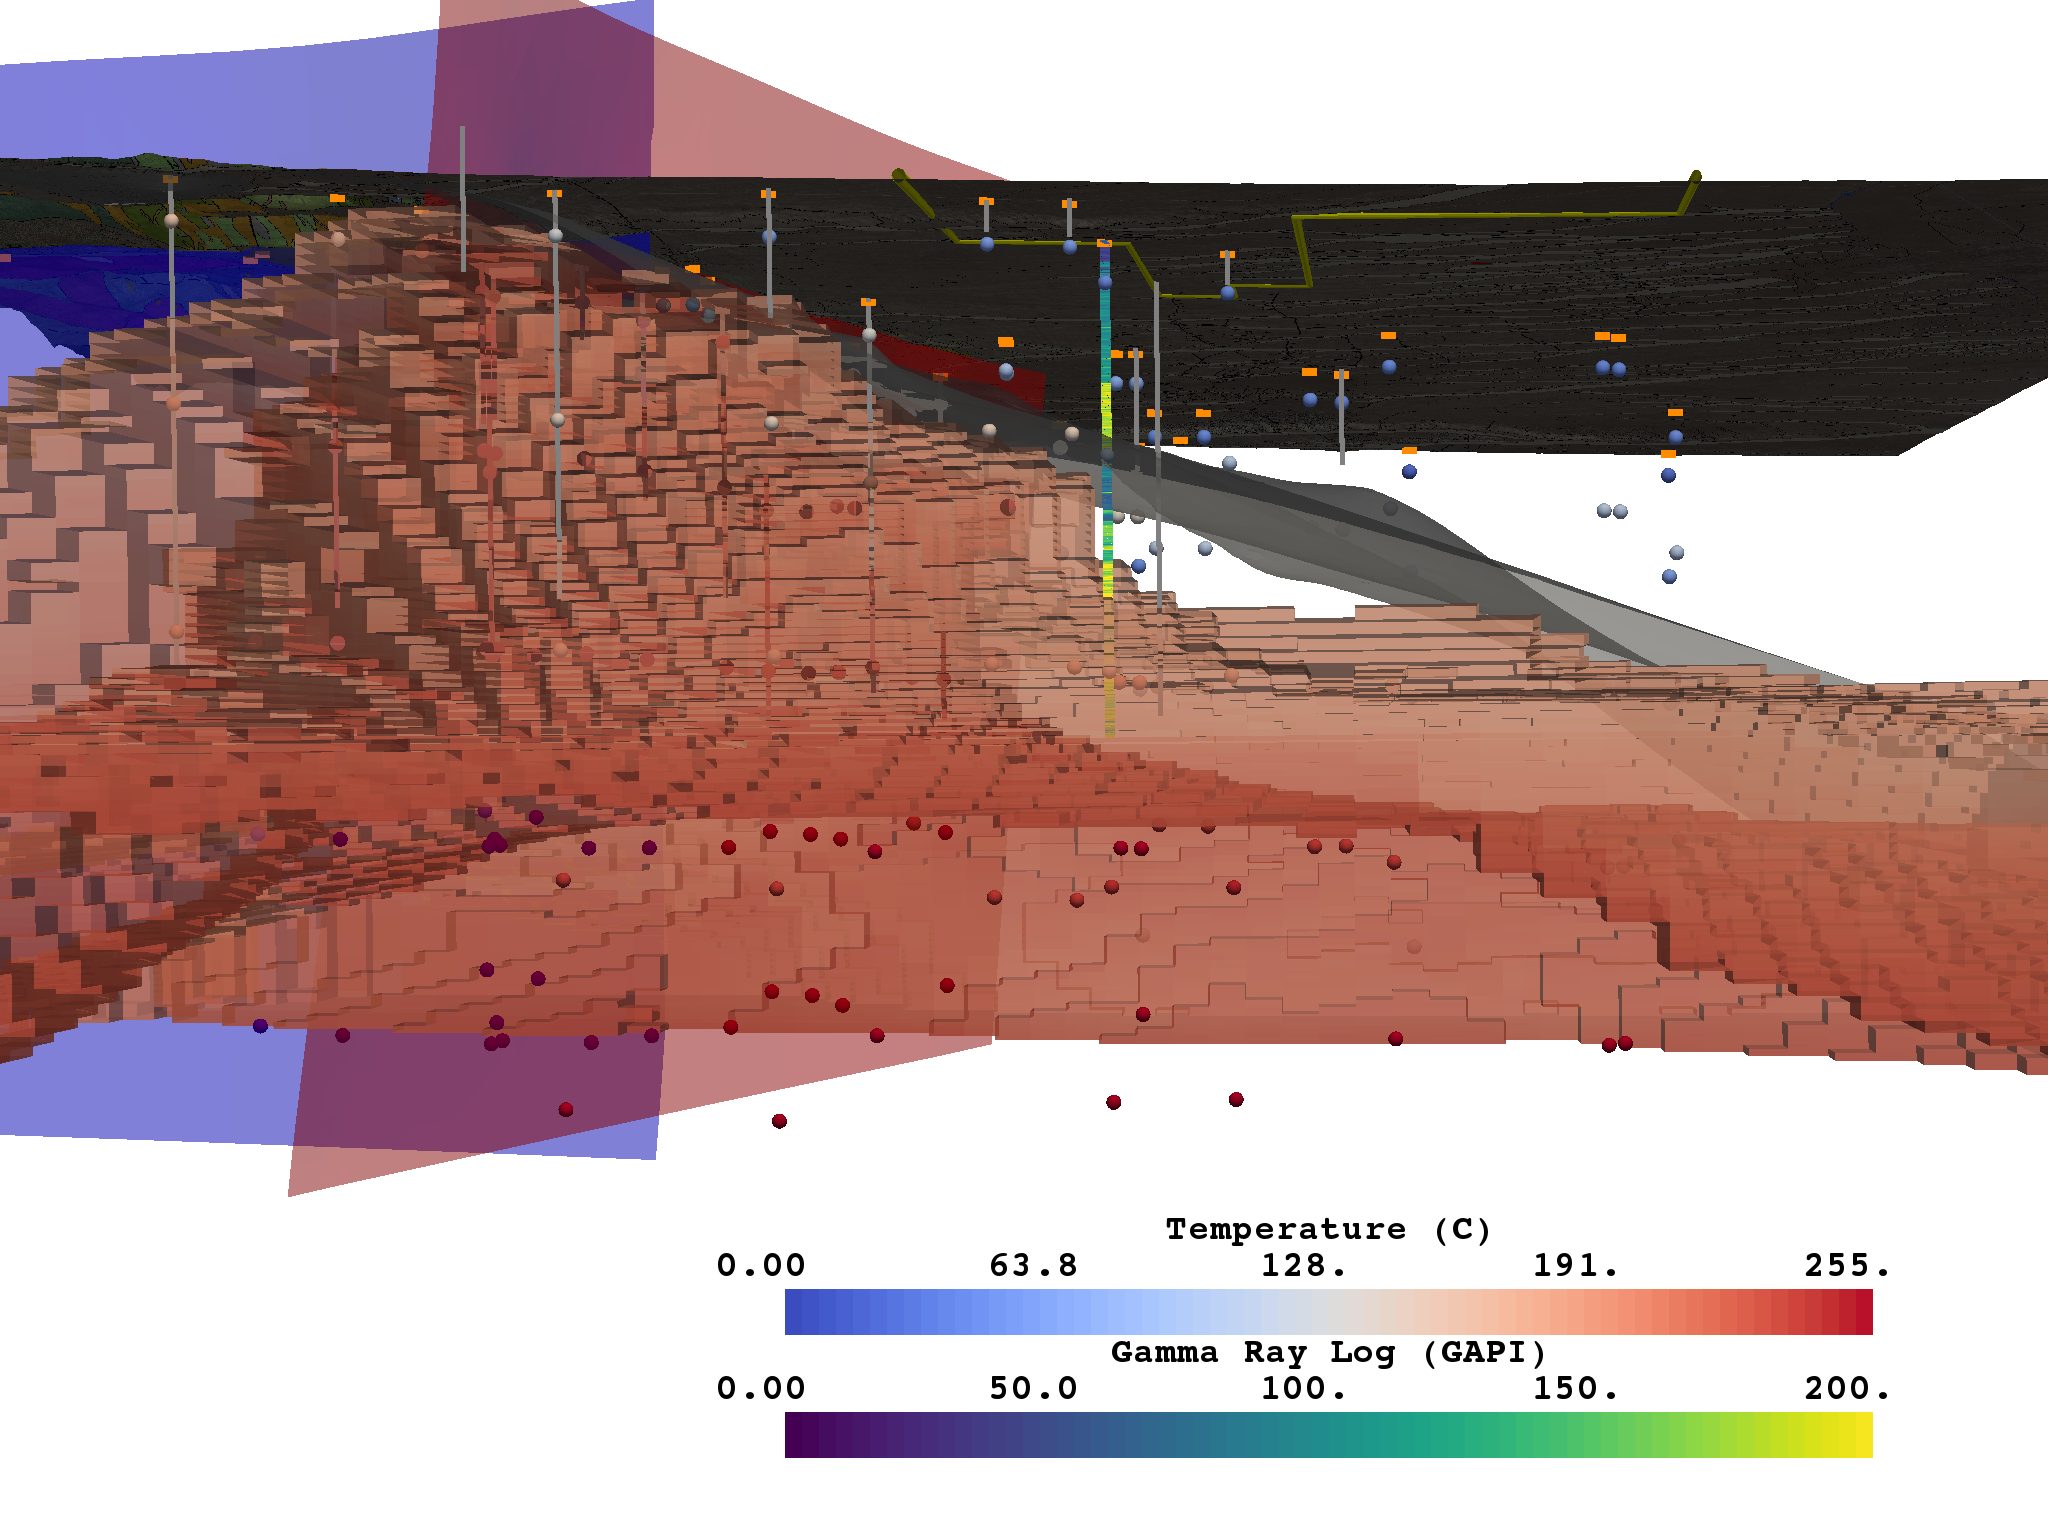
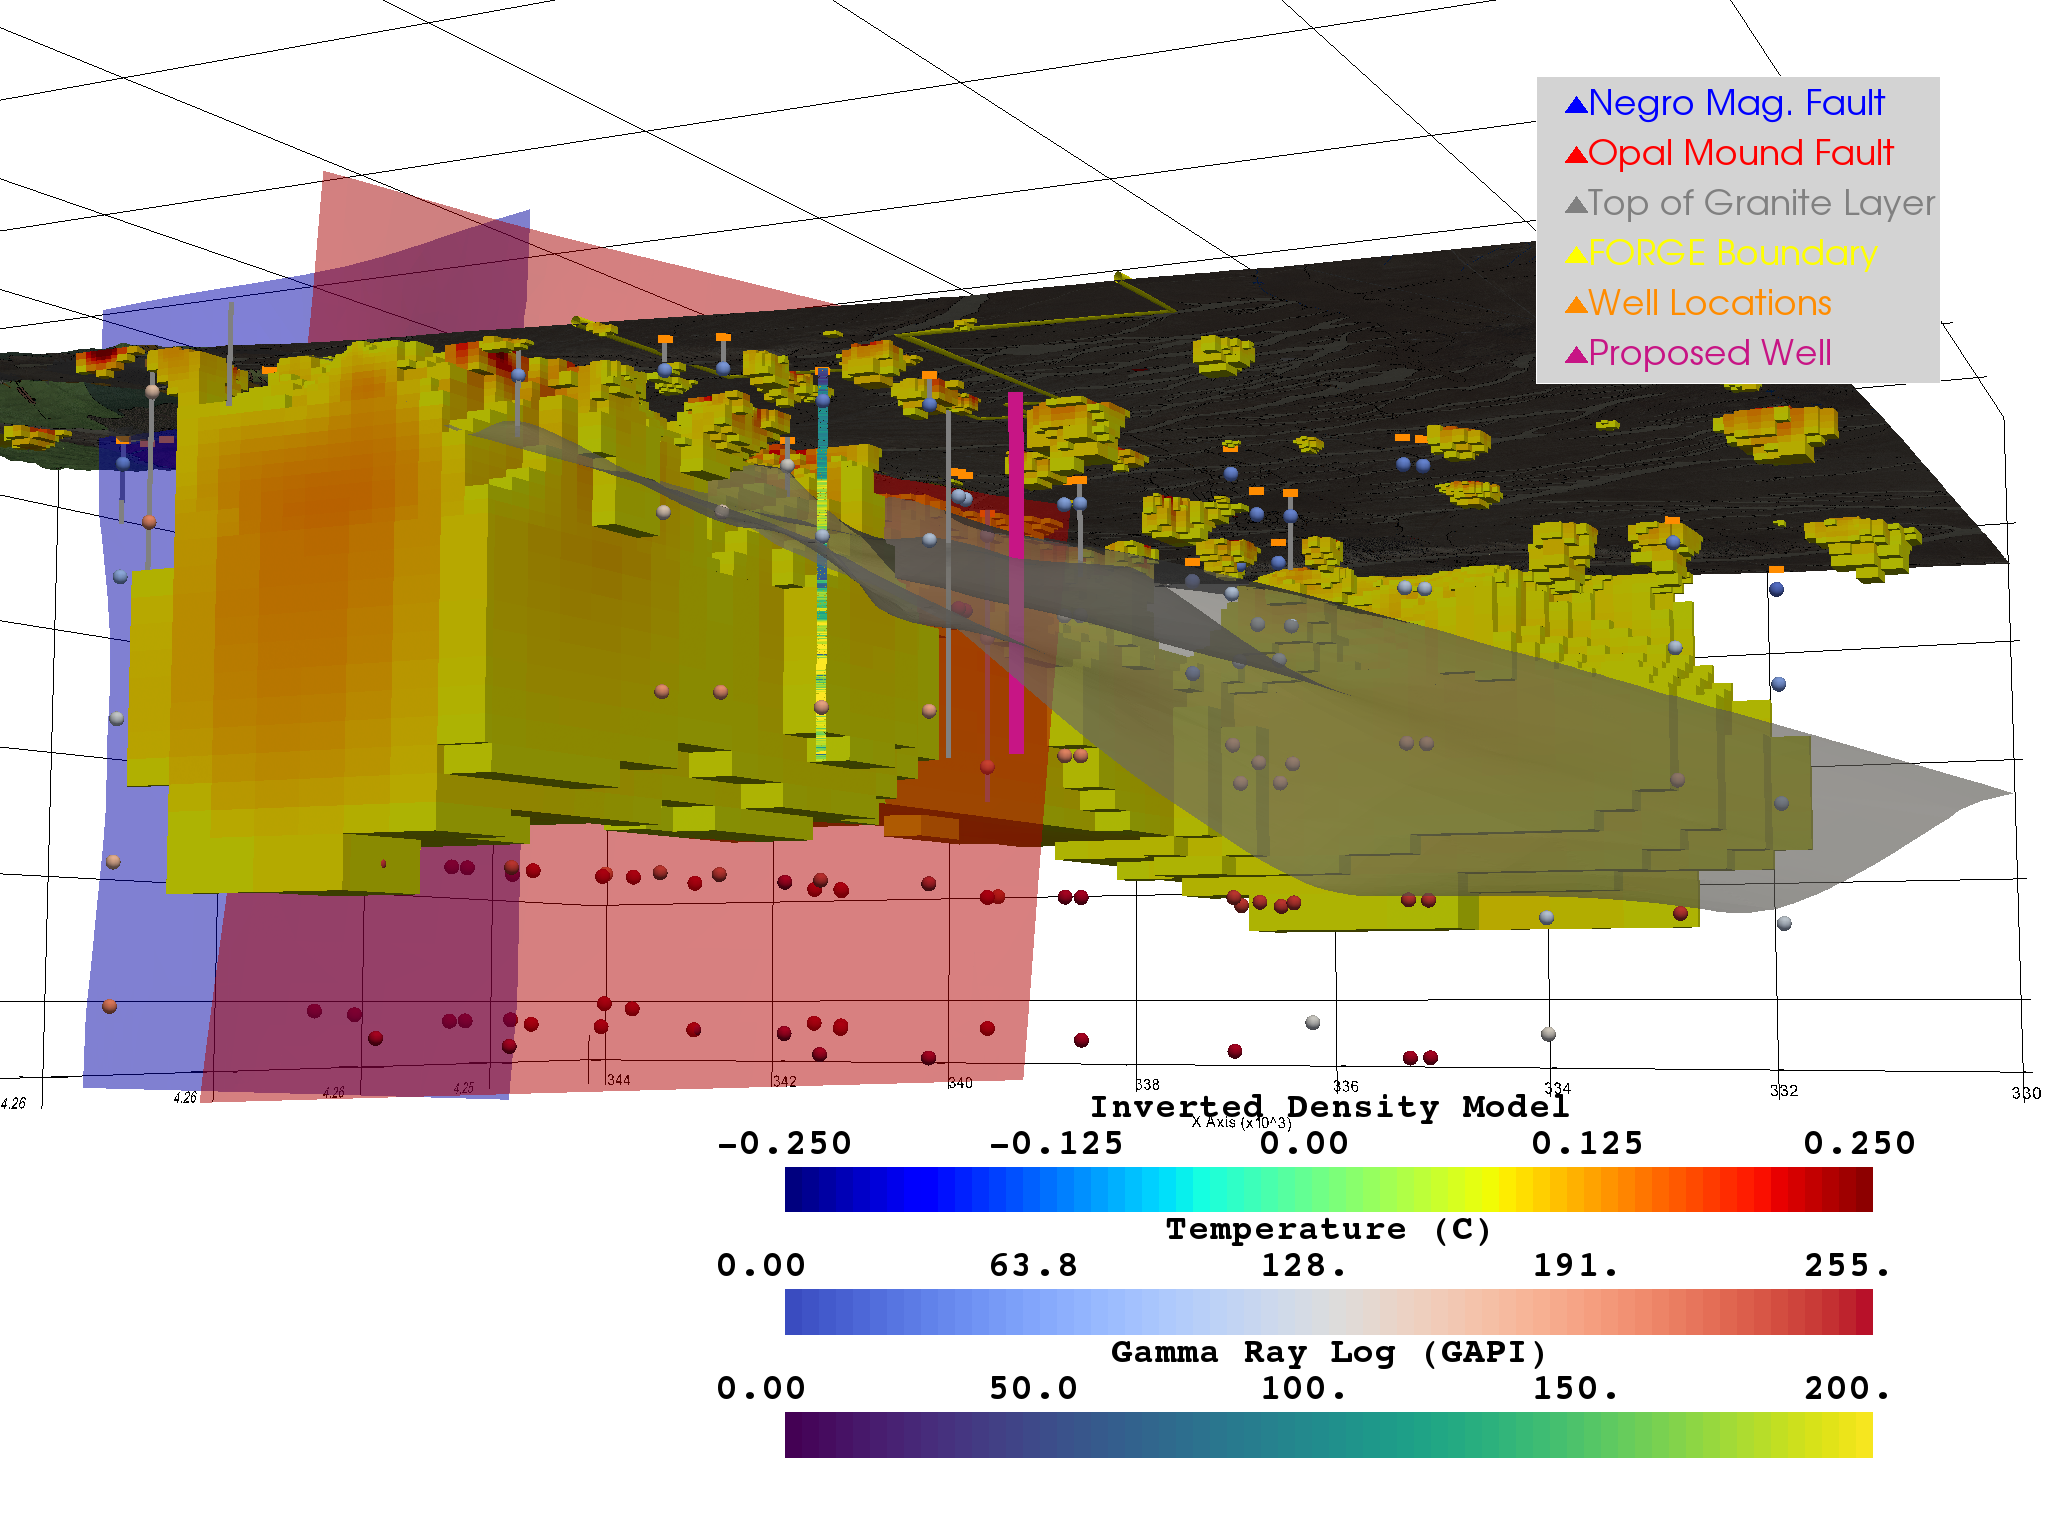
Figure 4
Regional subsurface view of the FORGE site with an added location, depth, and trajectory of our proposed production well.
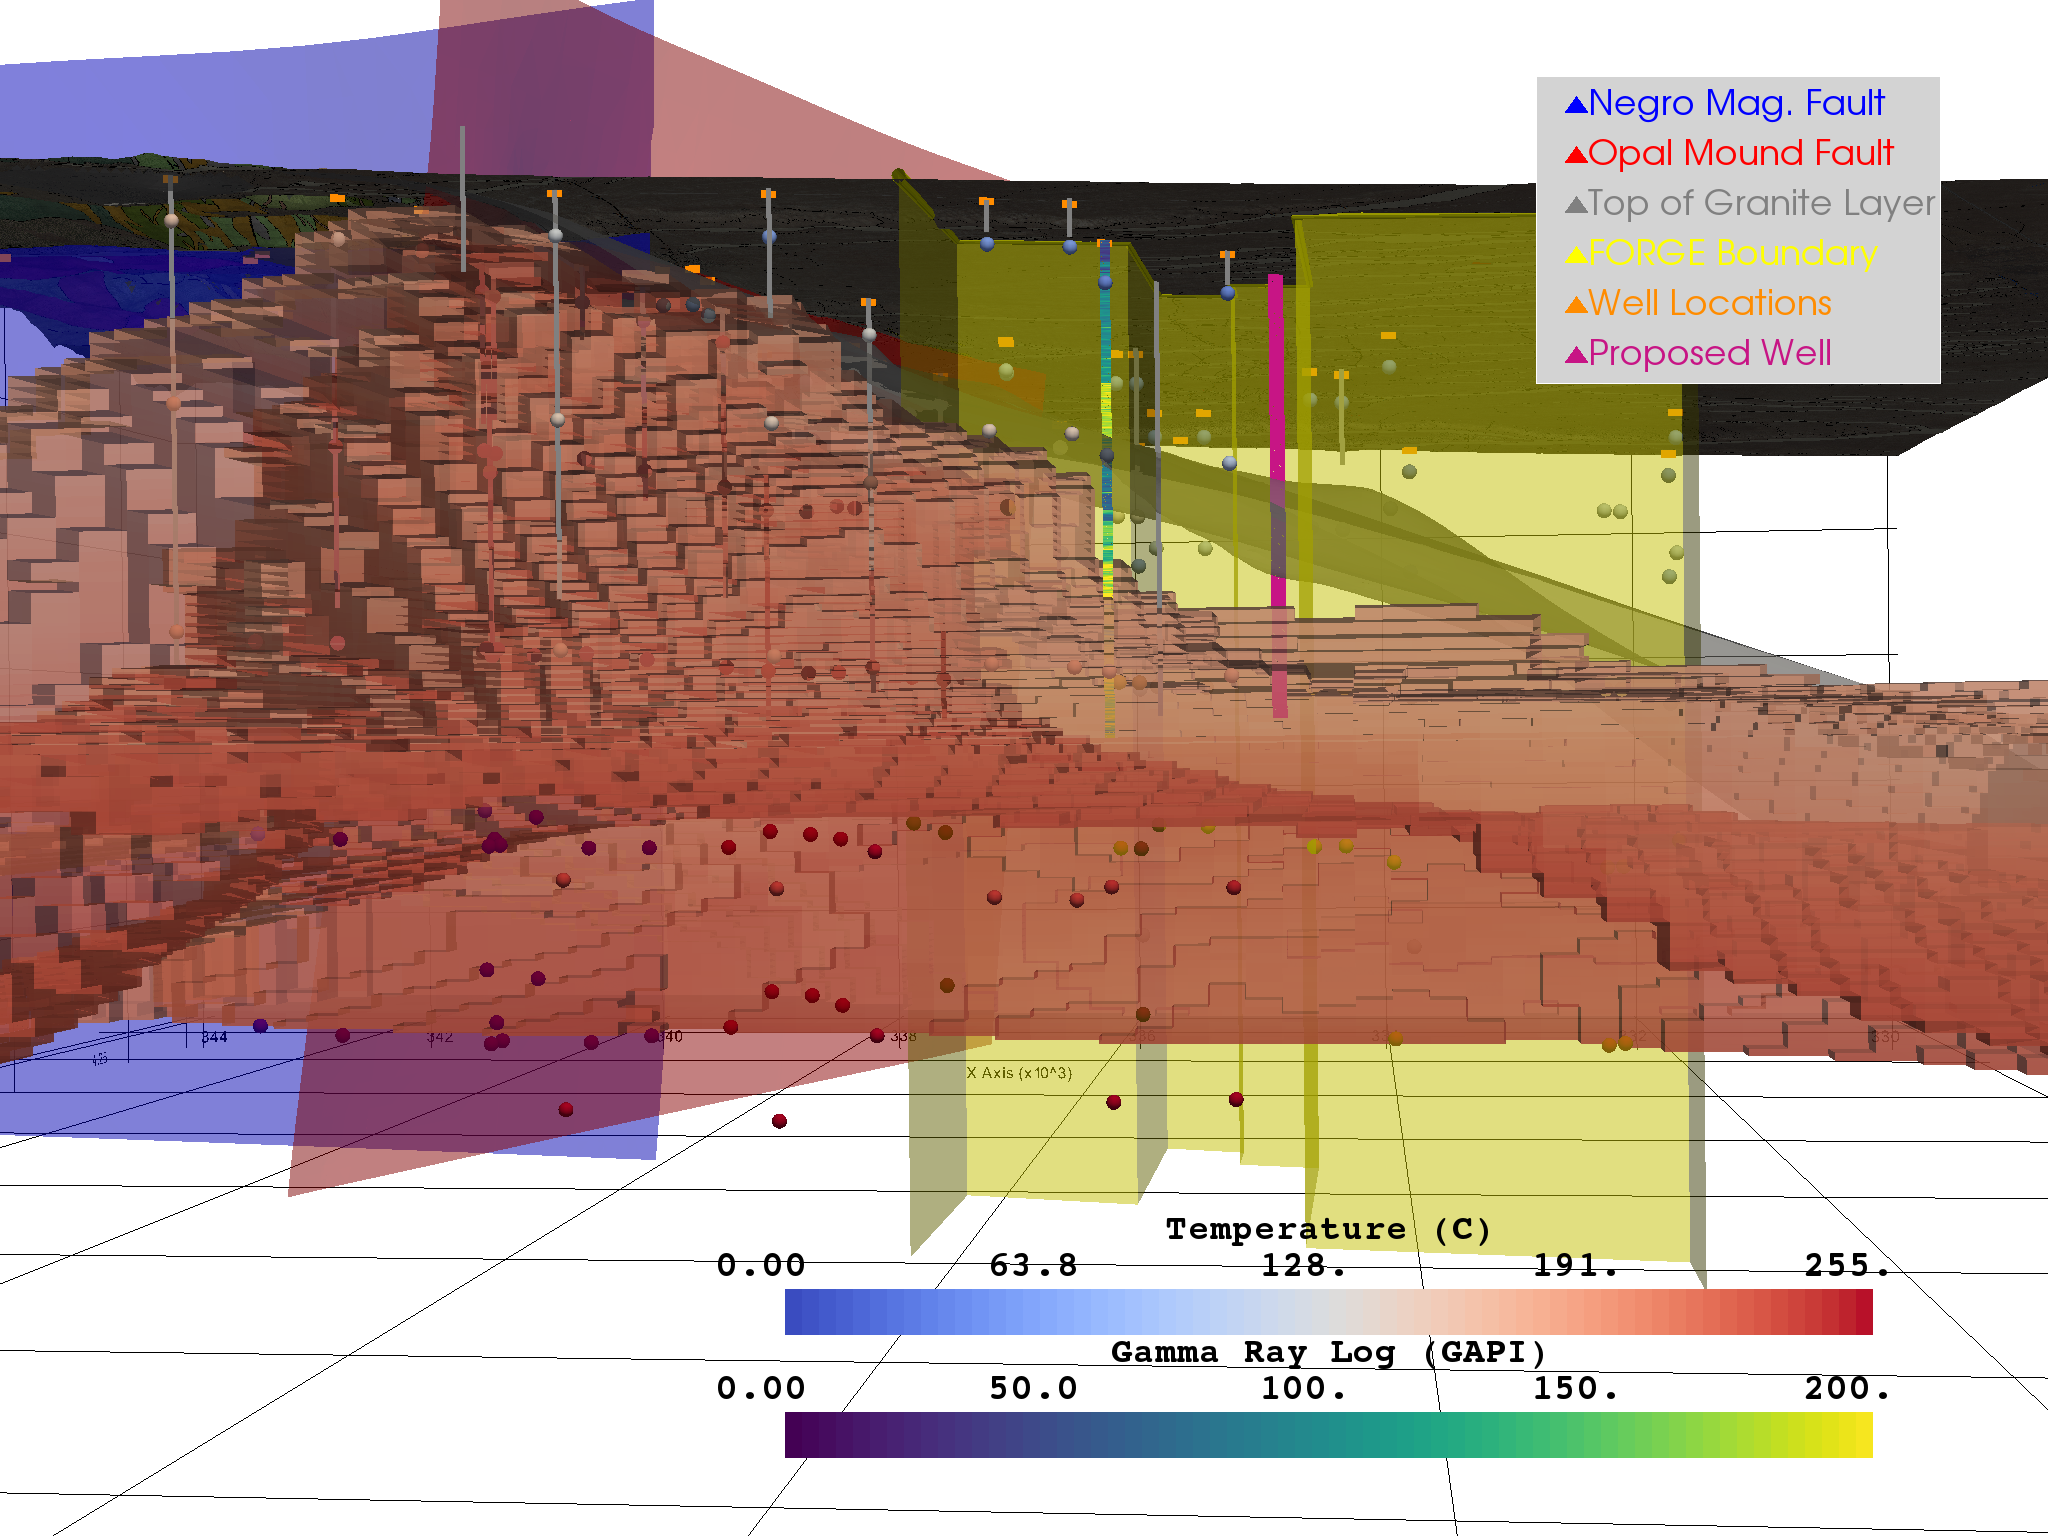
Figure 5
Subsurface view of the FORGE site with an added gravity model to show regional subsurface density trends