Note
Click here to download the full example code
Inspect Temperature Model
This notebook examines the temperature model and shows off a useful PVGeo algorithm for rmeove parts of a mesh/model that are baove a topographic surface.
# sphinx_gallery_thumbnail_number = 6

# Import project package
import gdc19
import pyvista
import PVGeo
import omfvista
import pandas as pd
import numpy as np
Load all the datasets created in the data aggreagation section
gis_data = omfvista.load_project(gdc19.get_project_path('gis.omf'))
print(gis_data.keys())
Out:
['boundary']
surfaces = omfvista.load_project(gdc19.get_project_path('surfaces.omf'))
print(surfaces.keys())
Out:
['land_surface', 'temp_225c', 'temp_175c', 'opal_mound_fault', 'negro_mag_fault', 'top_granitoid']
temperature_data = omfvista.load_project(gdc19.get_project_path('temperature.omf'))
print(temperature_data.keys())
Out:
['temperature', 'kriged_temperature_model']
Grab data from multi blocks for conveinance
topo = surfaces['land_surface']
granitoid = surfaces['top_granitoid']

p = pyvista.Plotter()
p.add_mesh(topo)
p.add_mesh(granitoid, color=True)
p.show()
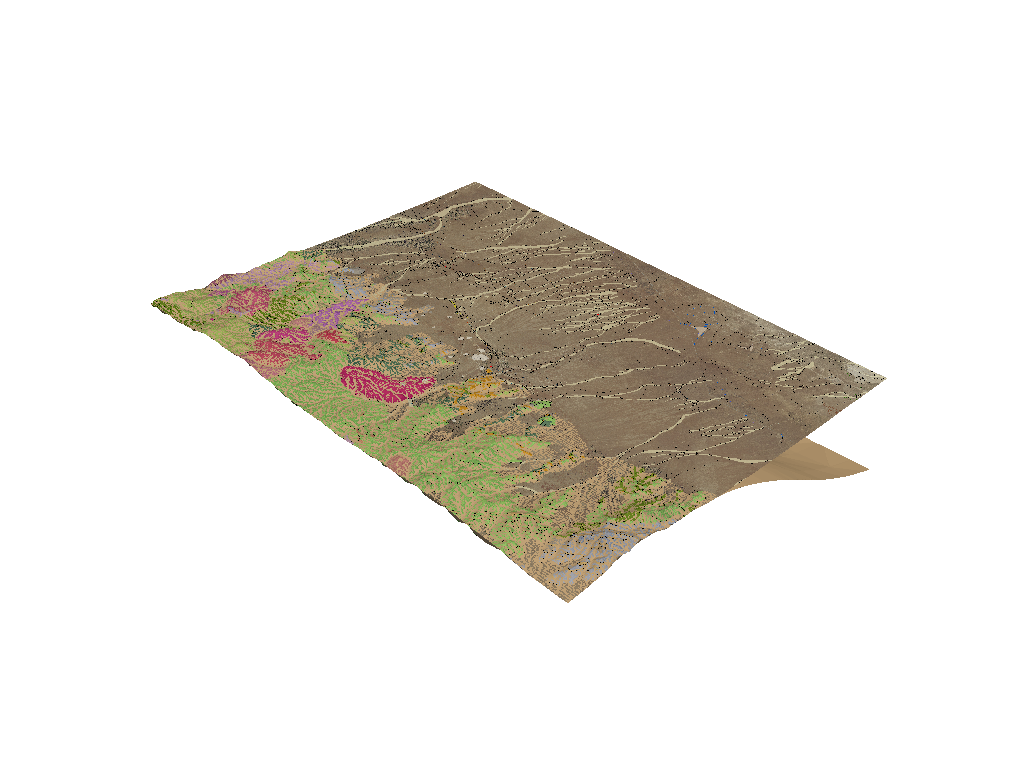
Note how the above figure has artificats from where the top of granite surface boundary matches the topographic surface. To mitigate these effect, we can use a filtering technique that will remove parts of a mesh above or within a tolerance of a given surface. PVGeo has a filter that perfroms this type of operation with ease.
Let’s run a PVGeo filter to extract the topo surface from the granitoid
surface - PVGeo.grids.ExtractTopography
# Run the PVGeo algorithm
granitoid = PVGeo.grids.ExtractTopography(
                remove=True, # remove the inactive cells
                tolerance=10.0 # buffer around the topo surface
            ).apply(granitoid, topo)

p = pyvista.Plotter()
p.add_mesh(topo)
p.add_mesh(granitoid, color=True)
p.show()
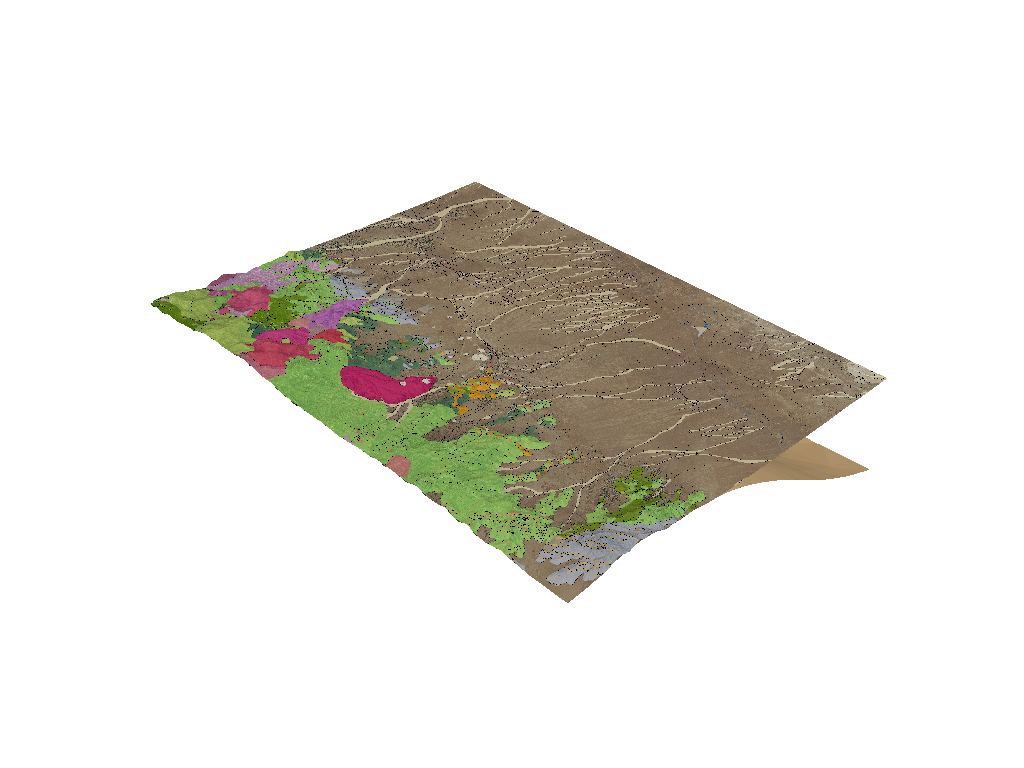
Now both the topographic surface and the granitoid boundary can be rendered without arficats due to where they overlap.
This type of topography extraction is often very useful with 3D models where the model domain goes above the topographic surface - thus we may want to parts of a 3D model above the topography. Let’s try this with the temoerature model.
temp_grid = temperature_data['kriged_temperature_model']

temp_kwargs = dict(
    cmap='coolwarm',
    clim=temp_grid.get_data_range(),
    stitle='Temperature (C)'
)
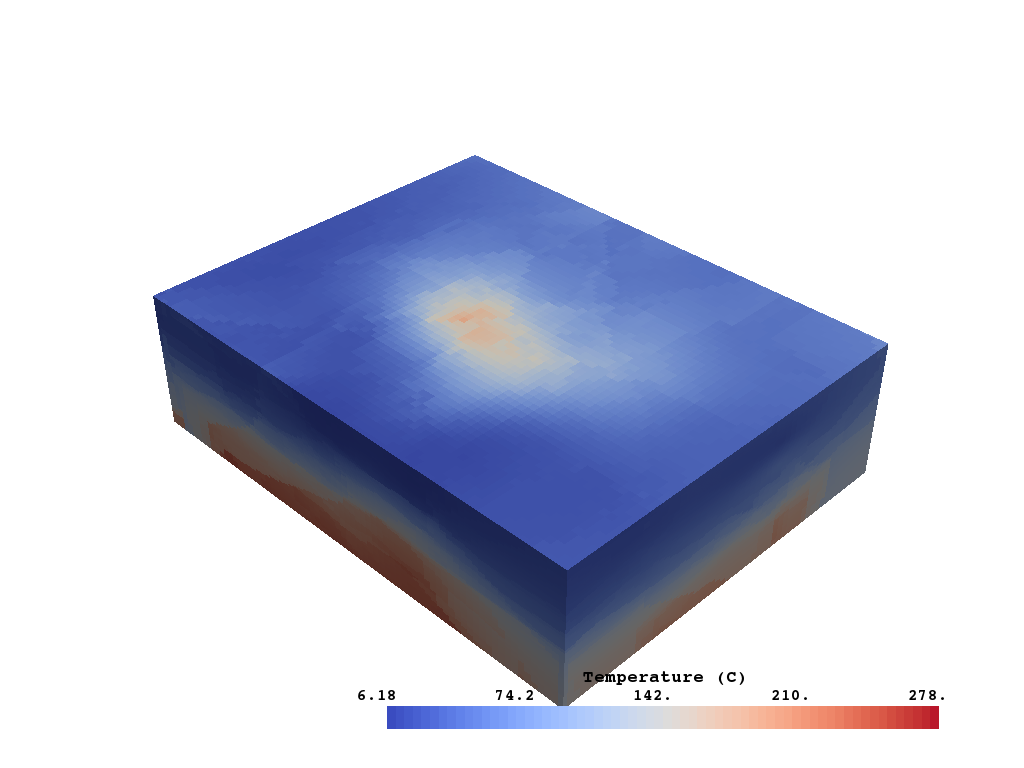
First, crop the model down to the FORGE region:
temp_grid_cropped = temp_grid.clip_box(gdc19.get_roi_bounds(), invert=False)
temp_grid_cropped.plot(**temp_kwargs)
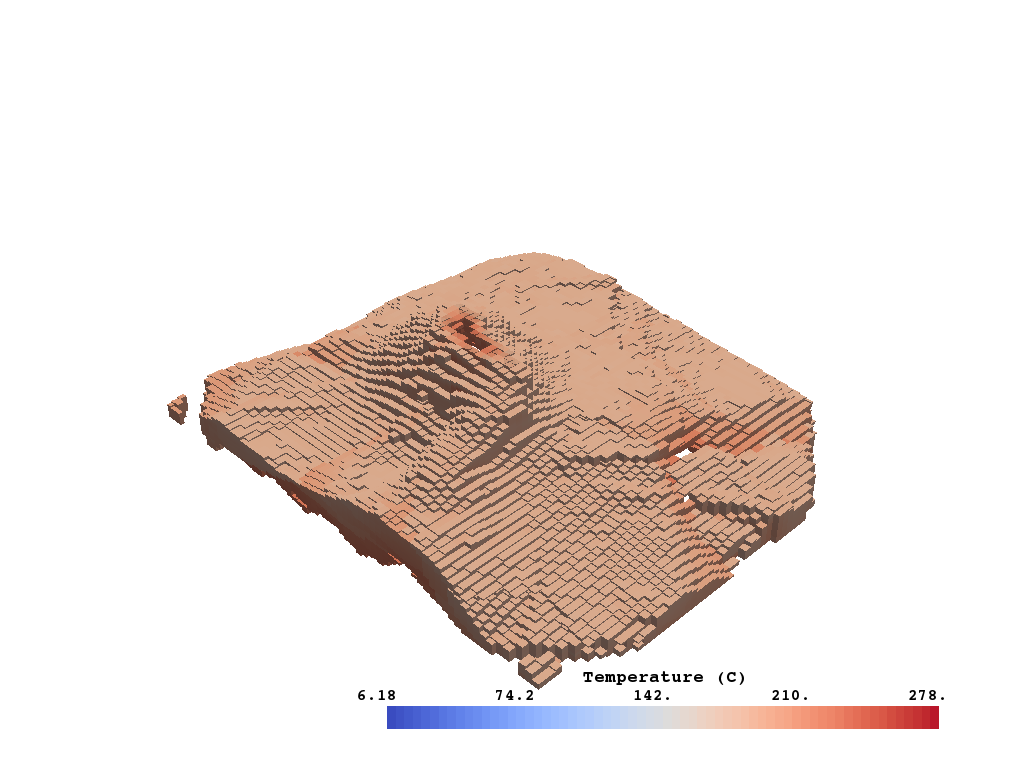
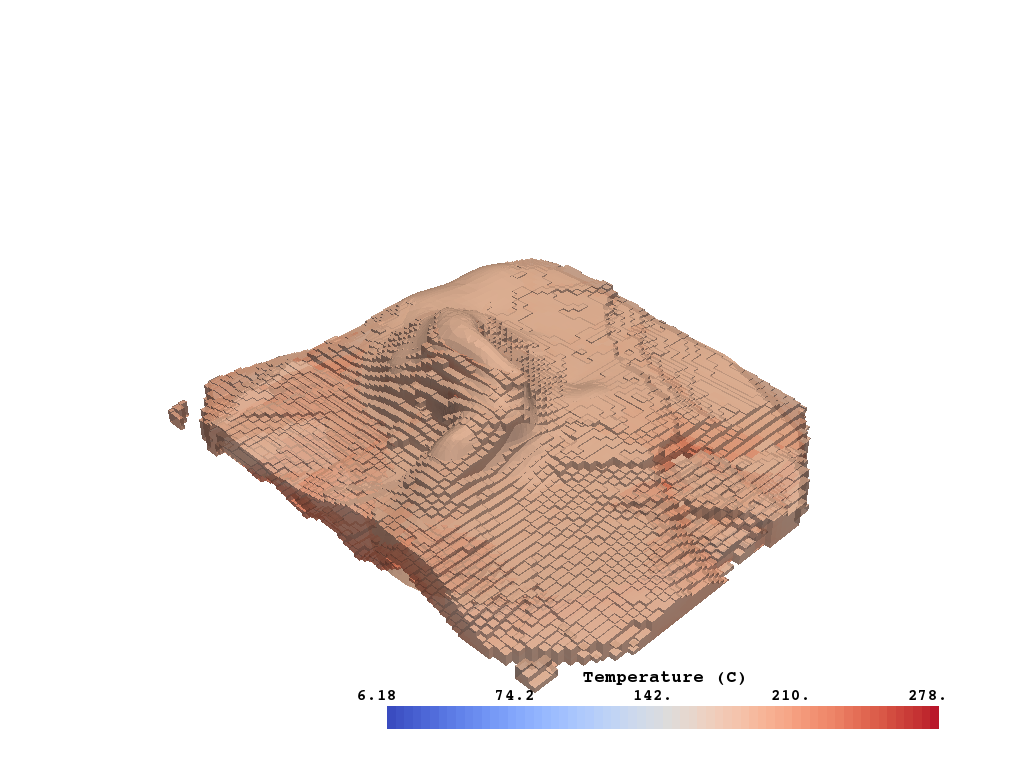
Now extract the topographic surface from the model to have a more realistic domain:
# Remove values above topography
temp_grid_no_topo = PVGeo.grids.ExtractTopography(
                remove=True, # remove the inactive cells
                tolerance=10.0 # buffer around the topo surface
               ).apply(temp_grid_cropped, topo)

temp_grid_no_topo.plot(**temp_kwargs)

Now lets find the temperature range of intereset: 175 to 225 degrees C
temp_roi = temp_grid_no_topo.threshold([175., 225.])
temp_roi.plot(**temp_kwargs)
And just out of curiosity, how big of a volume is that temperature range?
print('Temperature Region is {:.2f} cubic kilometers.'.format(temp_roi.volume * 1e-9))
Out:
Temperature Region is 229.00 cubic kilometers.
How do the provided temperature surfaces match our geostatisical model?
temp_175c = surfaces['temp_175c']
temp_225c = surfaces['temp_225c']

p = pyvista.Plotter()
p.add_mesh(temp_roi, opacity=0.7, **temp_kwargs)
p.add_mesh(temp_175c, **temp_kwargs)
p.add_mesh(temp_225c, **temp_kwargs)
p.show()
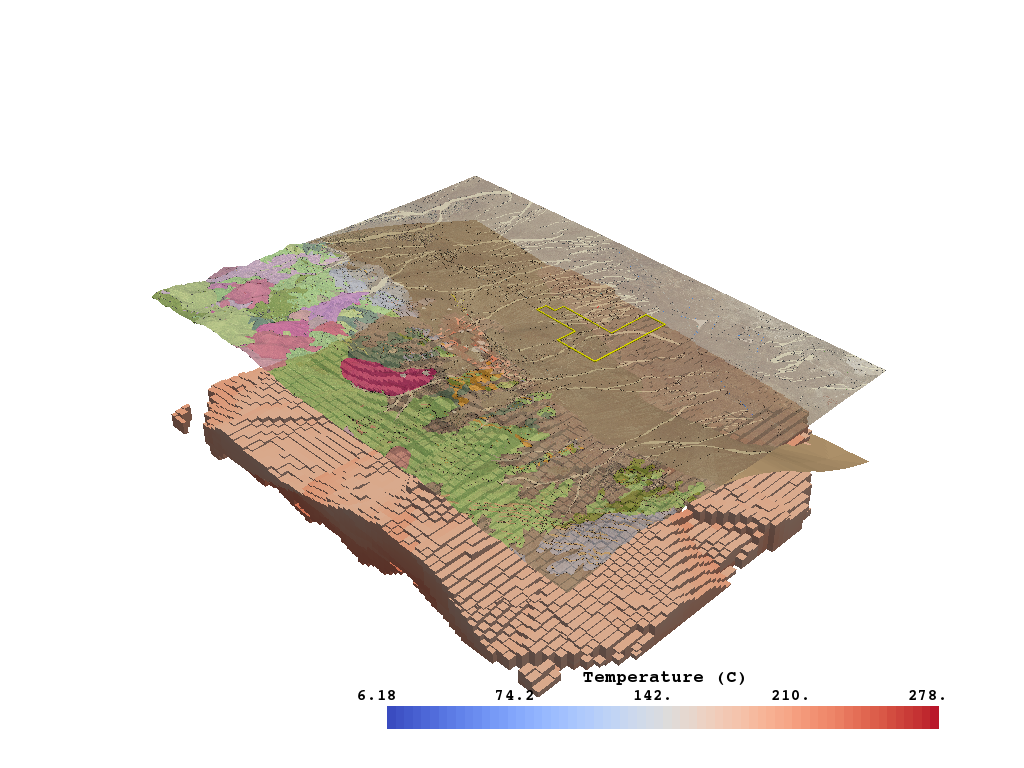
Now lets put this all together to gain insight on where that temperature plume is in relation to the FRGE site
boundary = gis_data['boundary']
boundary_tube = PVGeo.filters.AddCellConnToPoints(cell_type=4,
                    close_loop=True).apply(boundary).tube(radius=30)

p = pyvista.Plotter()
p.add_mesh(topo, opacity=0.7)
p.add_mesh(temp_roi, **temp_kwargs)
p.add_mesh(granitoid, color=True)
p.add_mesh(boundary_tube, color='yellow')
p.show()
Total running time of the script: ( 0 minutes 41.010 seconds)