Note
Click here to download the full example code
Submission Figures
This notebook will recreate all of the figures for the competition submission.
# sphinx_gallery_thumbnail_number = 5

# Import project package
import sys
sys.path.append('../..')
import gdc19
import pyvista
import PVGeo
import omfvista
import pandas as pd
import numpy as np
Load all the datasets created in the data aggreagation section
gis_data = omfvista.load_project(gdc19.get_project_path('gis.omf'))
print(gis_data.keys())
Out:
['boundary']
surfaces = omfvista.load_project(gdc19.get_project_path('surfaces.omf'))
print(surfaces.keys())
Out:
['land_surface', 'temp_225c', 'temp_175c', 'opal_mound_fault', 'negro_mag_fault', 'top_granitoid']
temperature_data = omfvista.load_project(gdc19.get_project_path('temperature.omf'))
print(temperature_data.keys())
Out:
['temperature', 'kriged_temperature_model']
Grab data to be used
topo = surfaces['land_surface']
granitoid = surfaces['top_granitoid']
temp_175c = surfaces['temp_175c']
temp_225c = surfaces['temp_225c']
Remove granite surface intereseting topography
granitoid = PVGeo.grids.ExtractTopography(
                remove=True, # remove the inactive cells
                tolerance=10.0 # buffer around the topo surface
               ).apply(granitoid, topo)
boundary = gis_data['boundary']
boundary_tube = PVGeo.filters.AddCellConnToPoints(cell_type=4,
                        close_loop=True).apply(boundary).tube(radius=30)
walls = PVGeo.filters.BuildSurfaceFromPoints(
                zcoords=[0., 4.5e3]).apply(boundary)
temp_grid = temperature_data['kriged_temperature_model']

temp_grid_cropped = temp_grid.clip_box(gdc19.get_roi_bounds(), invert=False)

# Remove values above topography
temp_grid = PVGeo.grids.ExtractTopography(
                remove=True, # remove the inactive cells
                tolerance=10.0 # buffer around the topo surface
               ).apply(temp_grid_cropped, topo)

temp_roi = temp_grid.threshold([175., 225.])
well_locs = pd.read_csv(gdc19.get_well_path('well_location_from_earth_model.csv'))
well_locs = PVGeo.points_to_poly_data(well_locs[['x', 'y', 'z (land surface)']].values).clip_box(
                    gdc19.get_roi_bounds(), invert=False)

WELLS = gdc19.load_well_db()
proposed = PVGeo.filters.AddCellConnToPoints().apply(WELLS.pop('well_new2'))#pyvista.MultiBlock()

well_5832 = PVGeo.filters.AddCellConnToPoints().apply(WELLS.pop('well_5832'))
#well_5832.set_active_scalar('ECGR')
well_Acord1 = PVGeo.filters.AddCellConnToPoints().apply(WELLS.pop('well_Acord1'))
#well_Acord1 = WELLS.set_active_scalar('GR_SPLICE (GAPI)')
load the gravity model
gf = gdc19.get_gravity_path('forge_inverse_problem/RESULT_THRESHED.vtu')
grav_model = pyvista.read(gf)
grav_model.active_scalar_name = 'Magnitude'
Plotting Helpers
Functions for adding datasets to a scene in a consistent manner
POINT_SIZE = 15
LINE_WIDTH = 15
pyvista.rcParams['window_size'] = np.array([1024, 768]) * 2
legend_color = pyvista.parse_color('lightgrey')
def clip_it(data, bounds):
    if bounds is None:
        return data
    return data.clip_box(bounds, invert=False)

def add_topo(p, bounds=None):
    data = clip_it(topo, bounds)
    if data.n_points < 1:
        return
    # We can update this to change the texture
    return p.add_mesh(data,
               texture='geo_aer',
               name='topo', color='white')#, opacity=0.85)

def add_faults(p, bounds=None):
    data = clip_it(surfaces['negro_mag_fault'], bounds)
    if data.n_points < 1:
        return
    f1 = p.add_mesh(data, name='negro_mag_fault',
           show_edges=False, color='blue', opacity=0.5,
           label='Negro Mag. Fault')
    data = clip_it(surfaces['opal_mound_fault'], bounds)
    if data.n_points < 1:
        return
    f2 = p.add_mesh(data, name='opal_mound_fault',
           show_edges=False, color='red', opacity=0.5,
                   label='Opal Mound Fault')
    return f1, f2

def add_granite(p, bounds=None):
    data = clip_it(granitoid, bounds)
    if data.n_points < 1:
        return
    return p.add_mesh(data, name='top_granitoid',
               show_edges=False, style='surface',
               color='grey', opacity=0.65, reset_camera=False,
               label='Top of Granite Layer')


def add_boundary(p, bounds=None):
    data = clip_it(boundary_tube, bounds)
    if data.n_points < 1:
        return
    return p.add_mesh(data, name='boundary',  color='yellow',
                      render_lines_as_tubes=False, line_width=10,
                      label='FORGE Boundary')

def add_walls(p, bounds=None):
    data = clip_it(walls, bounds)
    if data.n_points < 1:
        return
    return p.add_mesh(data, name='walls',
               color='yellow', opacity=0.5)


temp_d_params = dict(cmap='coolwarm', stitle='Temperature (C)',
                     clim=[0, 255])

def add_temp_model(p, bounds=None, contour=False, opacity=1.0):
    if contour:
        data = temp_grid.cell_data_to_point_data().contour([175, 225])
    else:
        data = temp_grid.threshold([175, 225])
    data = clip_it(data, bounds)
    if data.n_points < 1:
        return
    return p.add_mesh(data, name='temp_grid', opacity=opacity,
                      #label='Geostatistical Temperature Model',
                      **temp_d_params)


def add_temp_probes(p, bounds=None):
    data = clip_it(temperature_data['temperature'], bounds)
    if data.n_points < 1:
        return
    return p.add_mesh(data, name='temp',
               point_size=POINT_SIZE, render_points_as_spheres=True,
               #label='Temperature Probes',
               **temp_d_params)

def add_temp_surfs(p, bounds=None, style='surface'):
    data = clip_it(temp_175c, bounds)
    if data.n_points < 1:
        return
    # add the temperature boundaries
    s1 = p.add_mesh(data, name='temp_175c',
               style=style, opacity=0.7, **temp_d_params)
    data = clip_it(temp_225c, bounds)
    if data.n_points < 1:
        return
    s2 = p.add_mesh(data, name='temp_225c',
               style=style, opacity=0.7, **temp_d_params)
    return s1, s2


def add_well_collars(p, bounds=None):
    data = clip_it(well_locs, bounds)
    if data.n_points < 1:
        return
    return p.add_mesh(data, name='well_locations',
                      point_size=POINT_SIZE, color='darkorange',
                      label='Well Locations')

def add_well_traj(p, bounds=None):
    return p.add_mesh(WELLS, color='grey', name='WELLS',
                      reset_camera=False, render_lines_as_tubes=False, line_width=10,
                      )

WELL_COLOR = 'mediumvioletred'
def add_well_traj_proposed(p, bounds=None):
    return p.add_mesh(proposed, color=WELL_COLOR, name='proposed-wells',
                      reset_camera=False, render_lines_as_tubes=False, line_width=LINE_WIDTH,
                     label='Proposed Well')


def add_wells_with_data(p, bounds=None):
    title = 'Gamma Ray Log (GAPI)' # Shows up as label on scalar bar
    data = clip_it(well_5832, bounds)
    if data.n_points < 1:
        return
    w1 = p.add_mesh(data, scalars='ECGR',
                   name='5832', clim=[0,200],
                   cmap='viridis', stitle=title,
                   render_lines_as_tubes=False, line_width=10)
    data = clip_it(well_Acord1, bounds)
    if data.n_points < 1:
        return
    w2 = p.add_mesh(data,
                   scalars=' GR_SPLICE (GAPI)',
                   name = 'Acord1',
                   clim=[0, 200], cmap = 'viridis',
                   stitle=title,
                   render_lines_as_tubes=False, line_width=10)
    return w1, w2


def add_wells_with_data_solid(p, bounds=None):
    title = ''
    data = clip_it(well_5832, bounds)
    if data.n_points < 1:
        return
    w1 = p.add_mesh(data,
                   name='5832', color='gray',
                   render_lines_as_tubes=False, line_width=10)
    data = clip_it(well_Acord1, bounds)
    if data.n_points < 1:
        return
    w2 = p.add_mesh(data,
                   name = 'Acord1', color='gray',
                    render_lines_as_tubes=False, line_width=10)
    return w1, w2


def add_grav_model(p, bounds=None, opacity=1.0, rng=[-0.25,0.25]):
    data = grav_model.threshold(0.07)
    data = clip_it(data, bounds)
    if data.n_points < 1:
        return
    return p.add_mesh(data, name='grav_model', clim=rng,
                      opacity=opacity, cmap='jet',
                    stitle='Inverted Density Model'
                      #label='Density Model',
                        )
Figure 1
This figure shows the a model of Milford Valley, Utah with topography, fault, granite, FORGE site and well locations and data
def fig_1(p, bounds=None):
    add_topo(p, bounds)
    add_faults(p, bounds)
    add_granite(p, bounds)
    add_boundary(p, bounds)
    add_well_collars(p, bounds)
    add_well_traj(p, bounds)
    add_wells_with_data_solid(p, bounds)
    return

p = pyvista.Plotter()
fig_1(p)
p.camera_position = [(314607.07454842806, 4234127.240330922, 12678.810422767268),
                     (337504.84888541873, 4261501.390341784, 138.79188840111613),
                     (0.22757507410880431, 0.24175047512873185, 0.9432742408331761)]
# p.show_grid()

# p.add_legend(bcolor=legend_color, border=True, )
cpos = p.show(auto_close=False)
# p.export_vtkjs(gdc19.EXPORT_PATH.format('figure-01'))
p.screenshot('figure-01.png')
p.close()
cpos
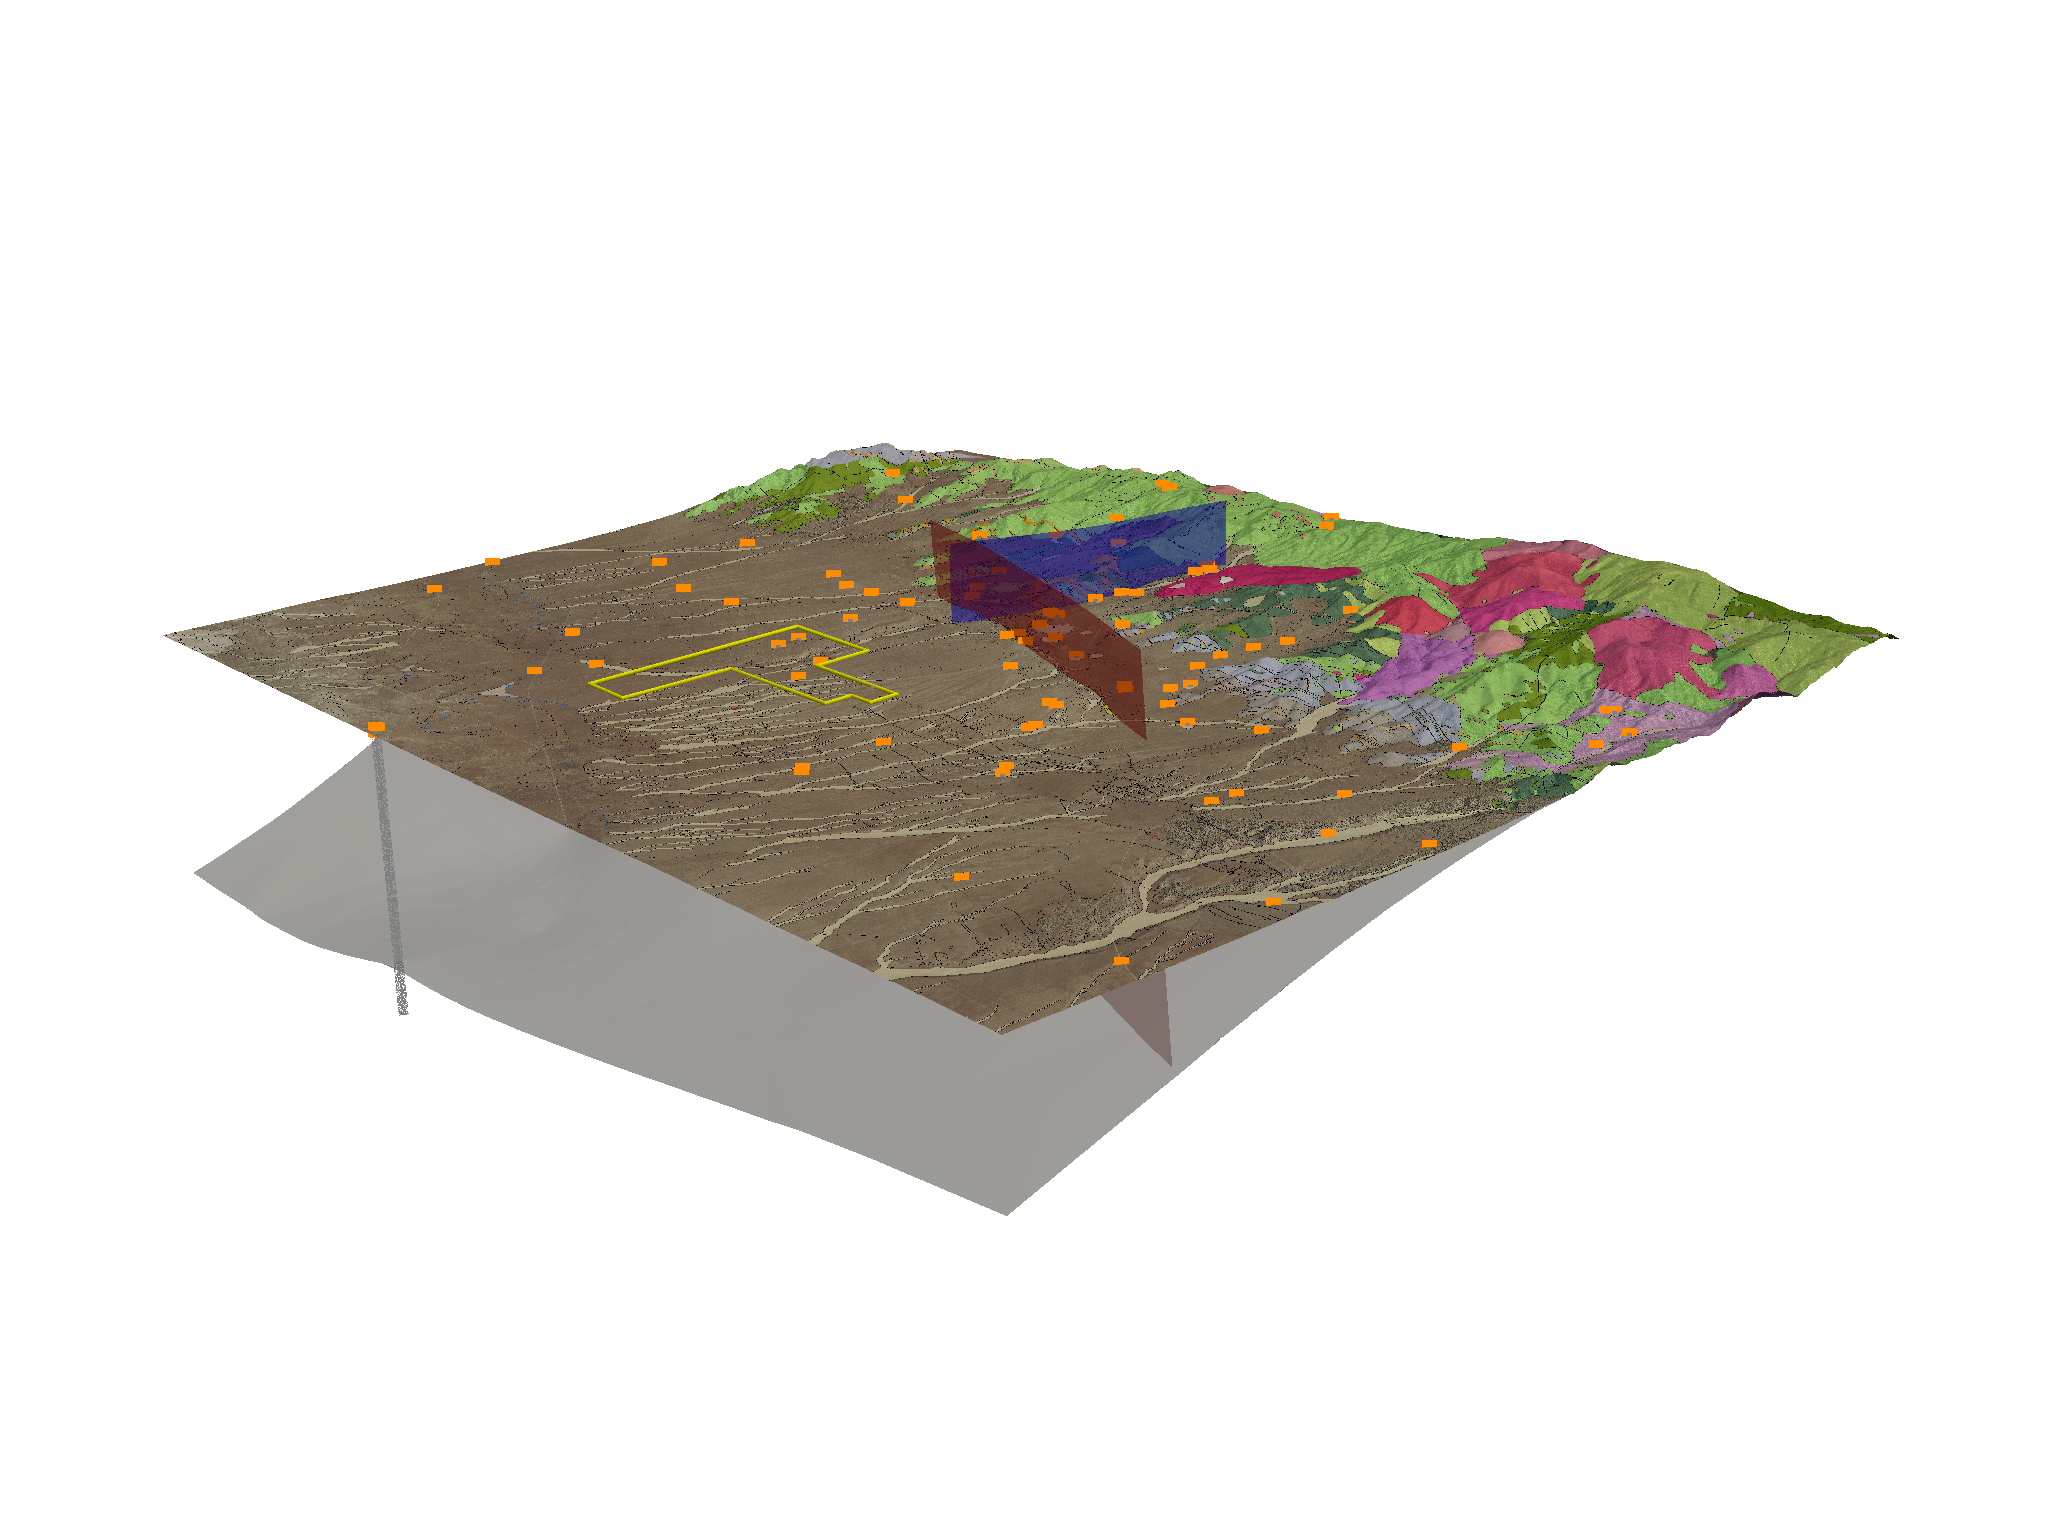
Figure 2
This figure shows a model of Milford Valley, Utah with topography, fault, granite, FORGE site and well, well logs, and temperature locations and data
def fig_2(p, bounds=None):
    fig_1(p, bounds)
    add_wells_with_data(p, bounds)
    add_temp_probes(p, bounds)
#     add_temp_surfs(p, bounds)

p = pyvista.Plotter()#notebook=False)
fig_2(p)
add_temp_model(p, None, False, .65)
p.camera_position = [(319034.6767280643, 4229153.193113267, 2134.2689148357804),
 (337792.27022585954, 4262182.34857588, -528.1616734381239),
 (0.03428354122002461, 0.060941228582444995, 0.9975524073753104)]

# p.show_grid()
# p.add_legend(bcolor=legend_color, border=True, )
cpos = p.show(auto_close=False)
# p.export_vtkjs(gdc19.EXPORT_PATH.format('figure-02'))
p.screenshot('figure.png')
p.close()
cpos
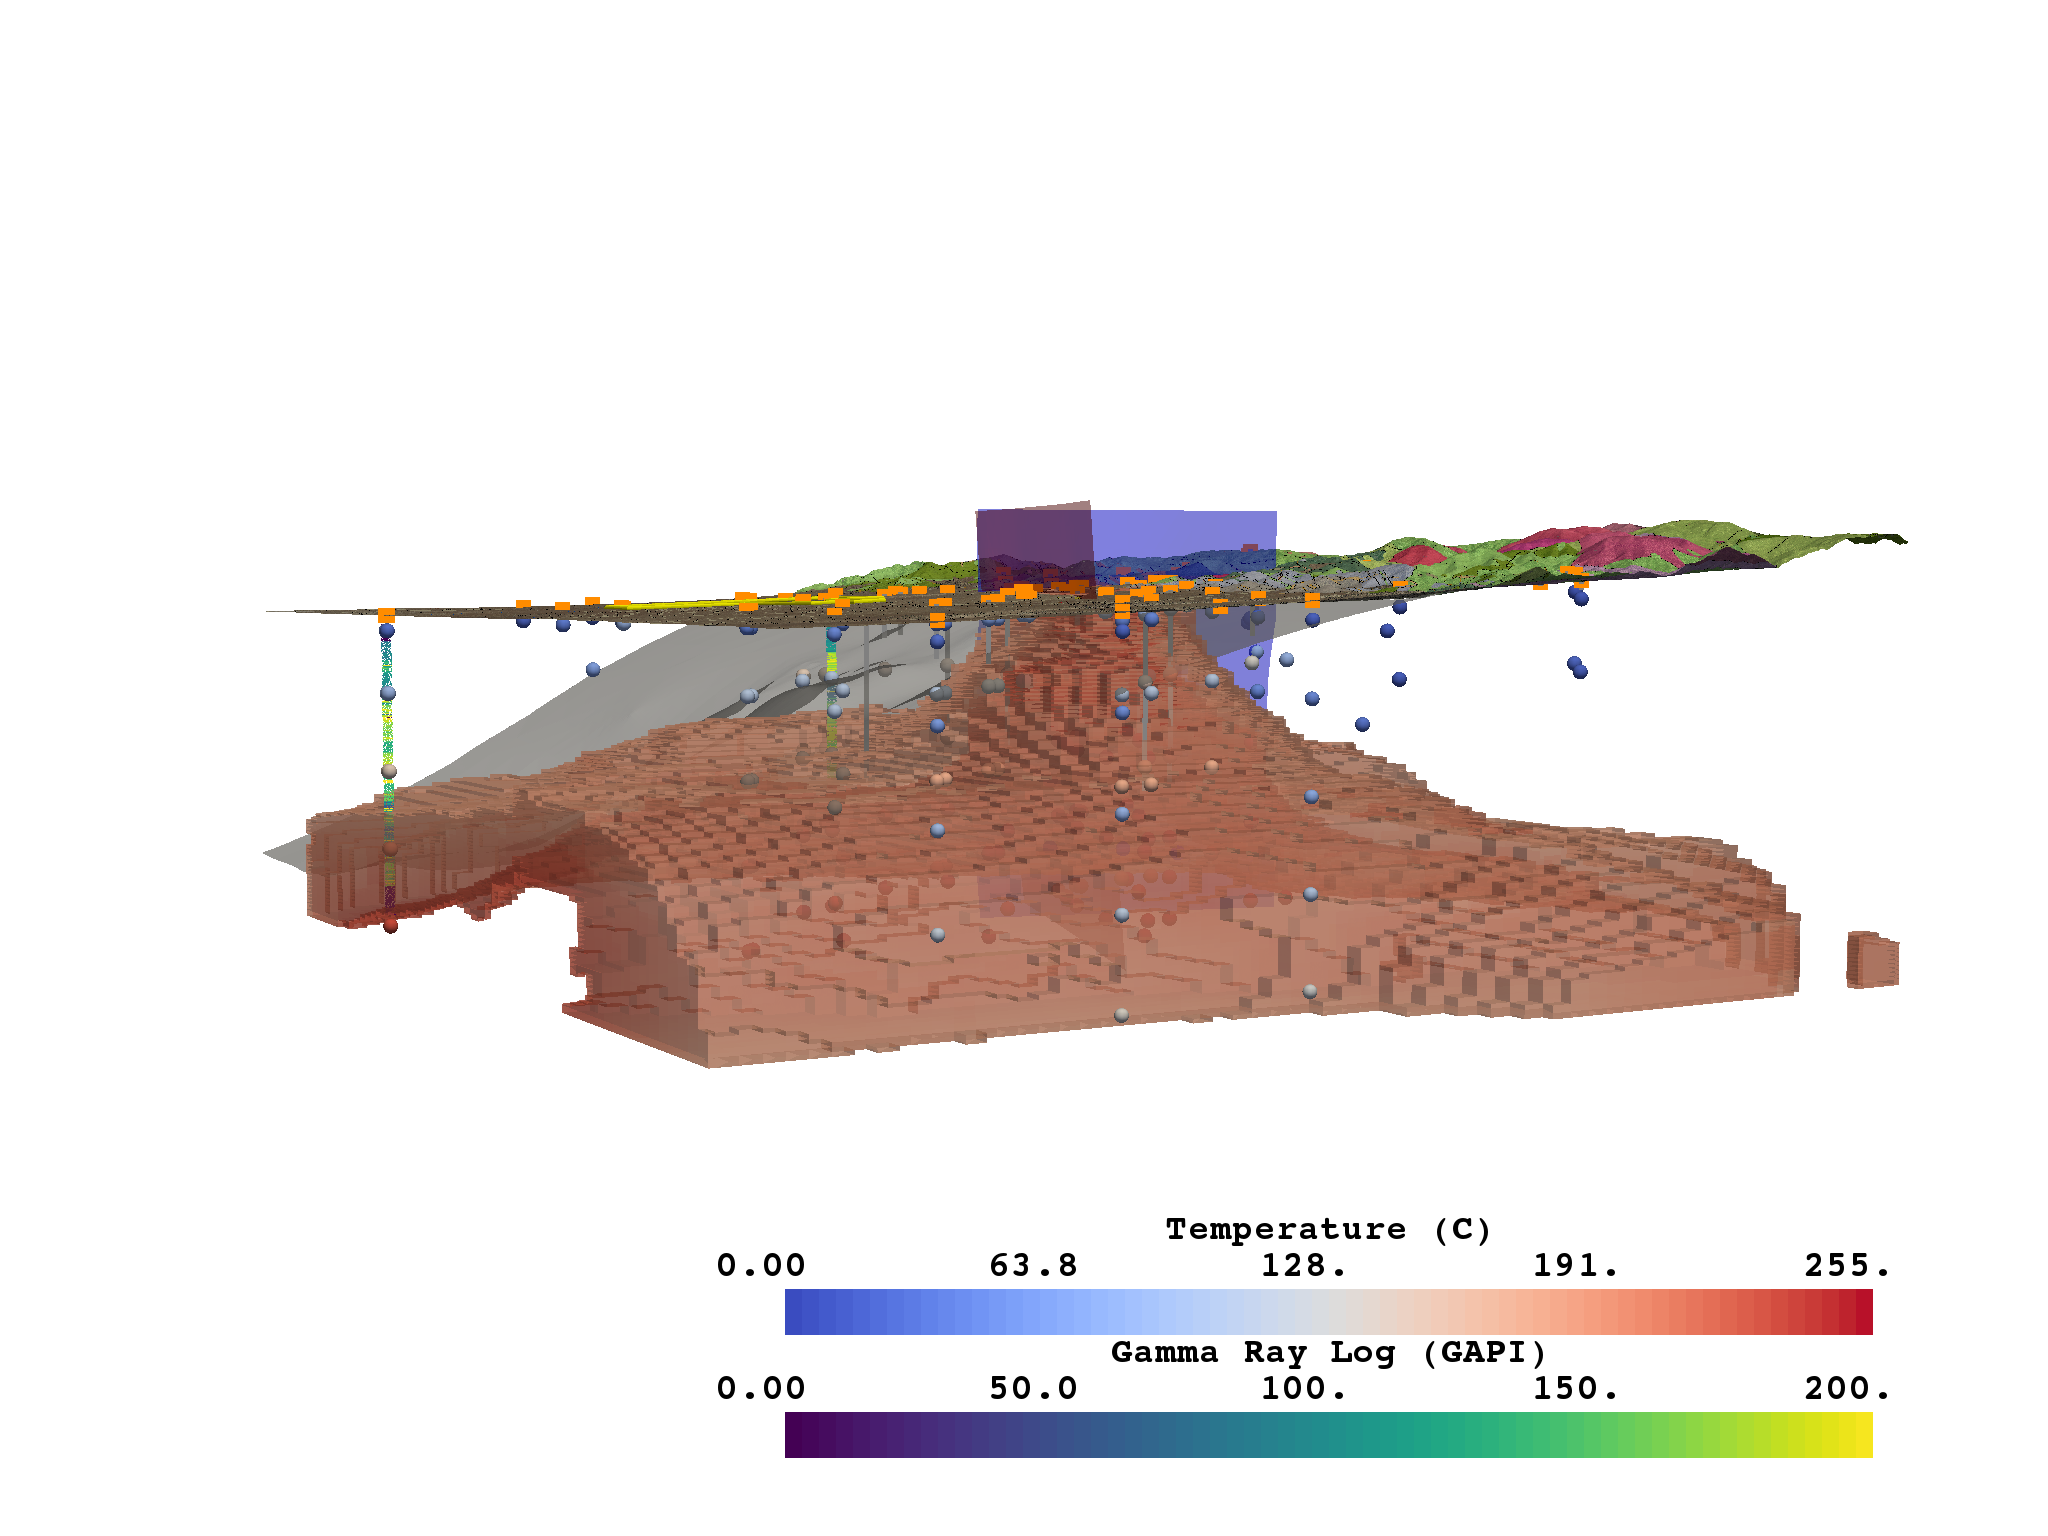
Figure 3
This figure shows a model of Milford Valley, Utah cropped from the north side of the FORGE site to better view the subsurface within the FORGE boundary
ROI_BOX = [329924.98816, 344152.930125, 4252833.48213,
              4264500.,
           -5000.0, 5000.0]

def fig_3(p, bounds=None):
    fig_2(p, bounds)
#     p.add_mesh(pyvista.Box(gdc19.get_roi_bounds()).outline(), color='k')
#     p.add_mesh(pyvista.Box(ROI_BOX).outline(), color='k')


p = pyvista.Plotter(notebook=False)
fig_3(p, ROI_BOX)
add_temp_model(p, ROI_BOX, False, .65)
# p.show_grid()
# p.add_legend(bcolor=legend_color, border=True, )
# p.camera_position = [(343748.9865580256, 4274071.829819304, -45.893656221421054),
#      (335873.1170201431, 4261751.962920492, -297.42280206922646),
#      (-0.02664145165280376, -0.0033777827209346117, 0.9996393467834896)]
p.camera_position = [(334281.36331699195, 4276292.535297218, -668.3030992158856),
 (335928.59853397467, 4261761.612826868, -771.3399610873013),
 (-0.010085221763558642, -0.008233535185890598, 0.9999152450084572)]
cpos = p.show(auto_close=False)
# p.export_vtkjs(gdc19.EXPORT_PATH.format('figure-03'))
p.screenshot('figure-03.png')
p.close()
cpos
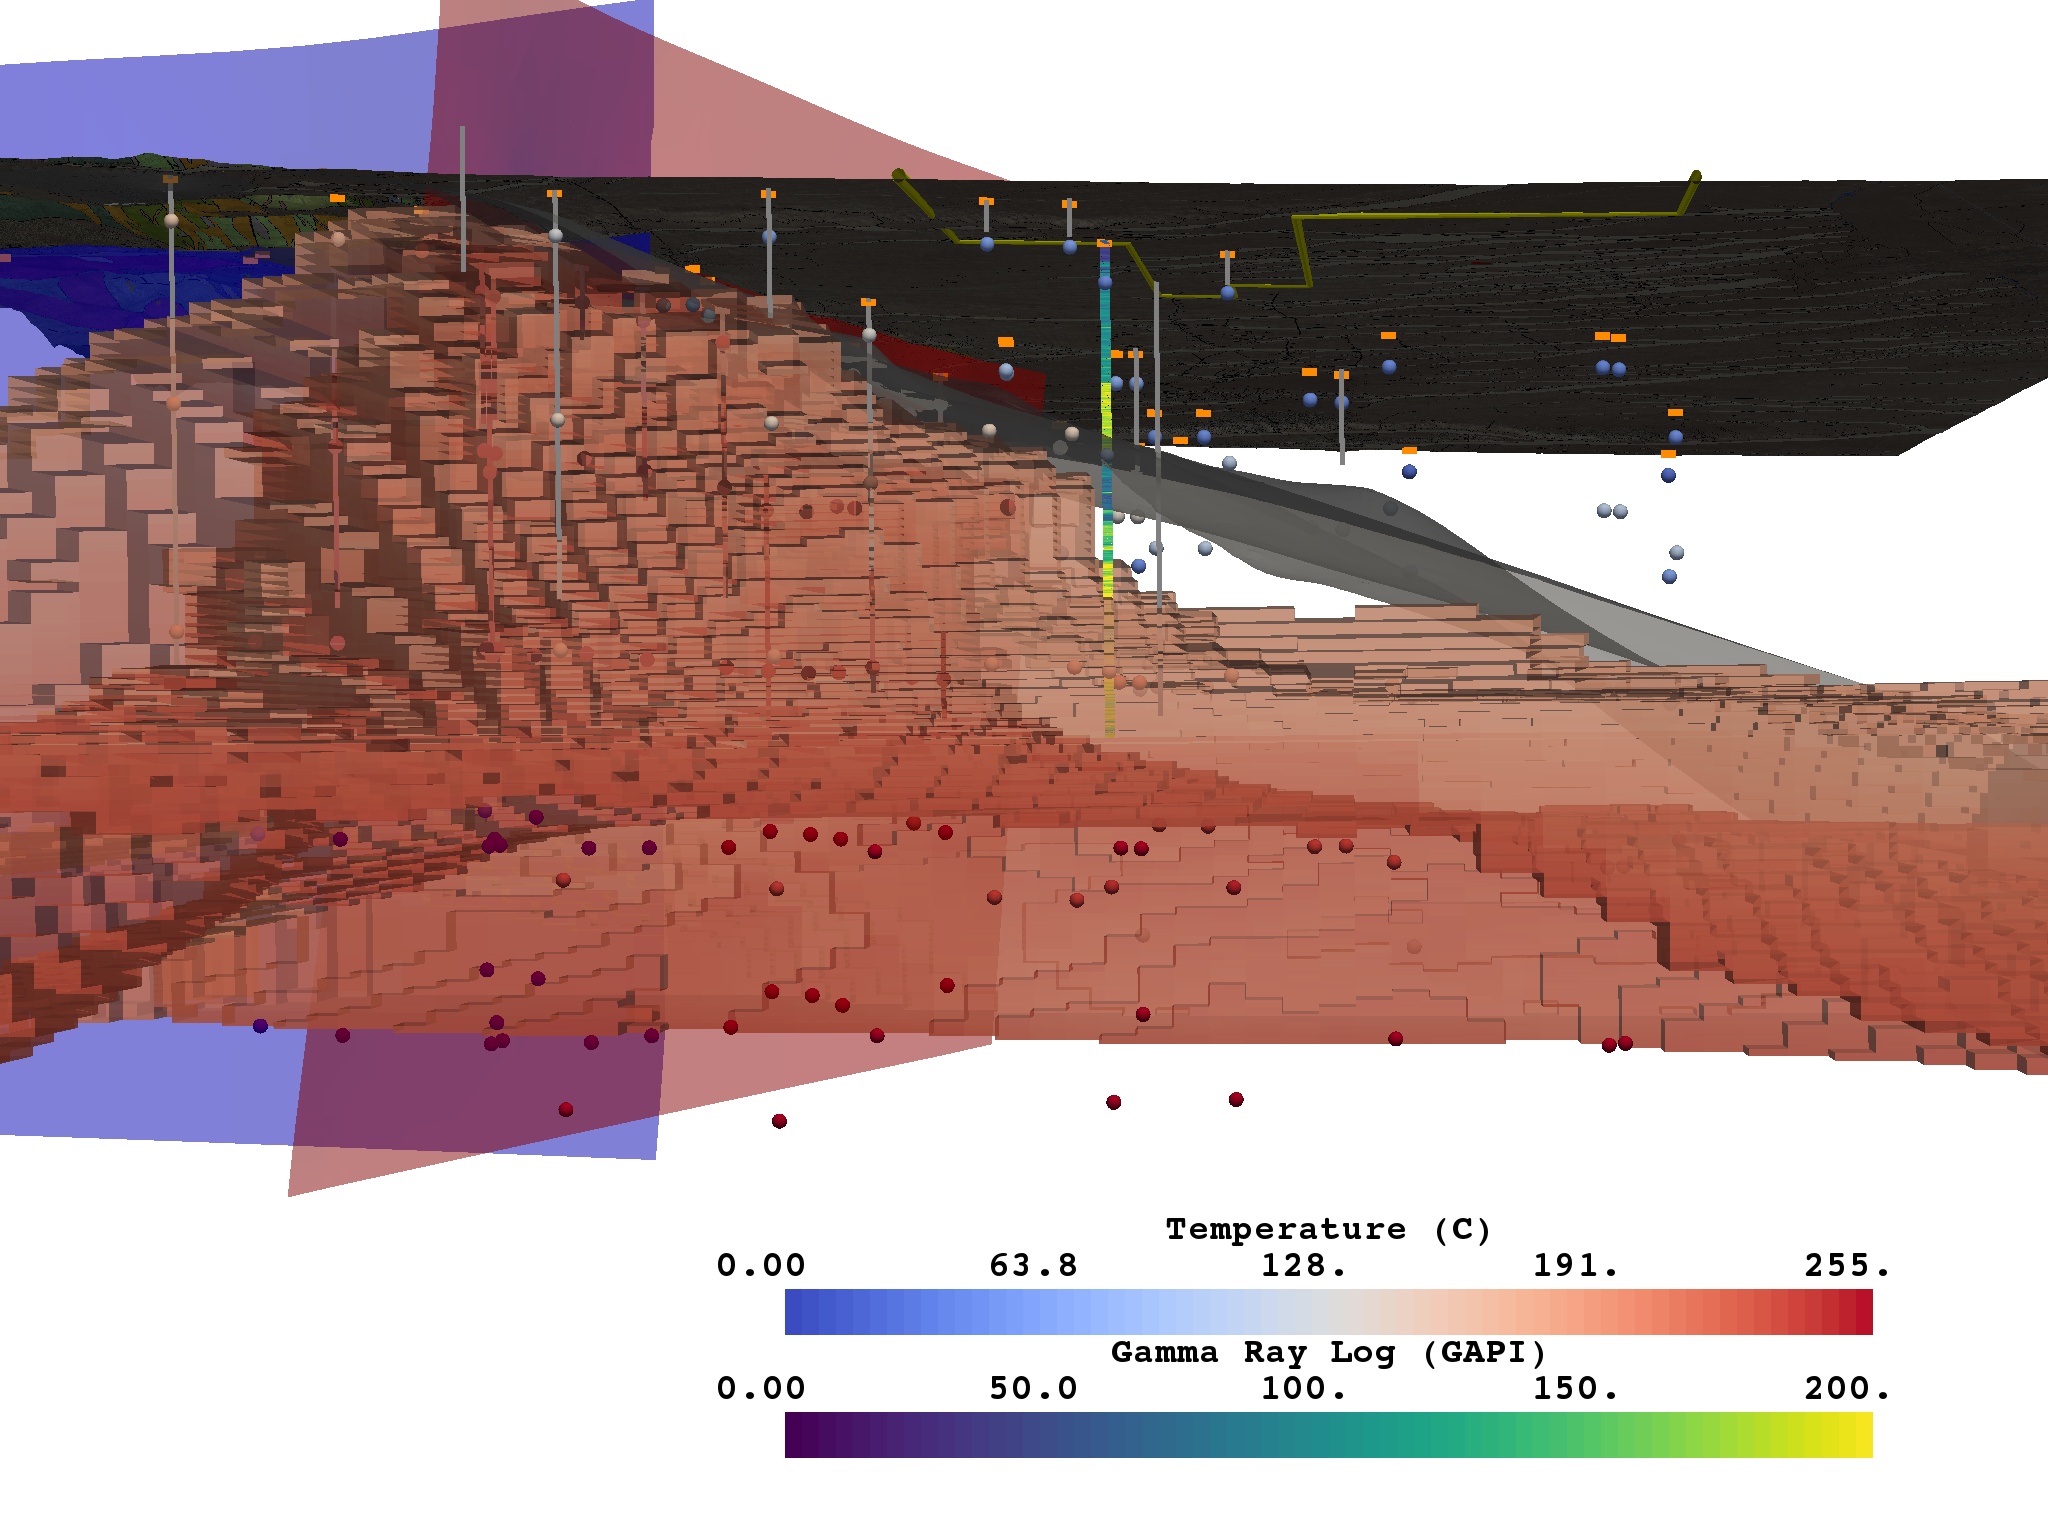
Figure 4
This figure shows a model of Milford Valley, Utah cropped to better view the FORGE site subsurface and includes our team’s proposed well location and trajectory (red).
def fig_4(p, bounds=None):
    fig_3(p, bounds)
    add_well_traj_proposed(p, bounds)
    add_walls(p, bounds)


p = pyvista.Plotter()
fig_4(p, ROI_BOX)
add_temp_model(p, ROI_BOX, opacity= .65)
p.show_grid()
p.add_legend(bcolor=legend_color, border=True,)
# p.camera_position = [(338420.51700107113, 4274437.238773895, 2955.1608950208406),
#                      (336736.7547587104, 4262114.162538592, -288.48406559676073),
#                      (-0.04936350860775744, -0.24792338675624506, 0.9675211823610093)]
p.camera_position = [(334281.36331699195, 4276292.535297218, -668.3030992158856),
 (335928.59853397467, 4261761.612826868, -771.3399610873013),
 (-0.010085221763558642, -0.008233535185890598, 0.9999152450084572)]
cpos = p.show(auto_close=False)
# p.export_vtkjs(gdc19.EXPORT_PATH.format('figure-04'))
p.screenshot('figure-04.png')
p.close()
cpos
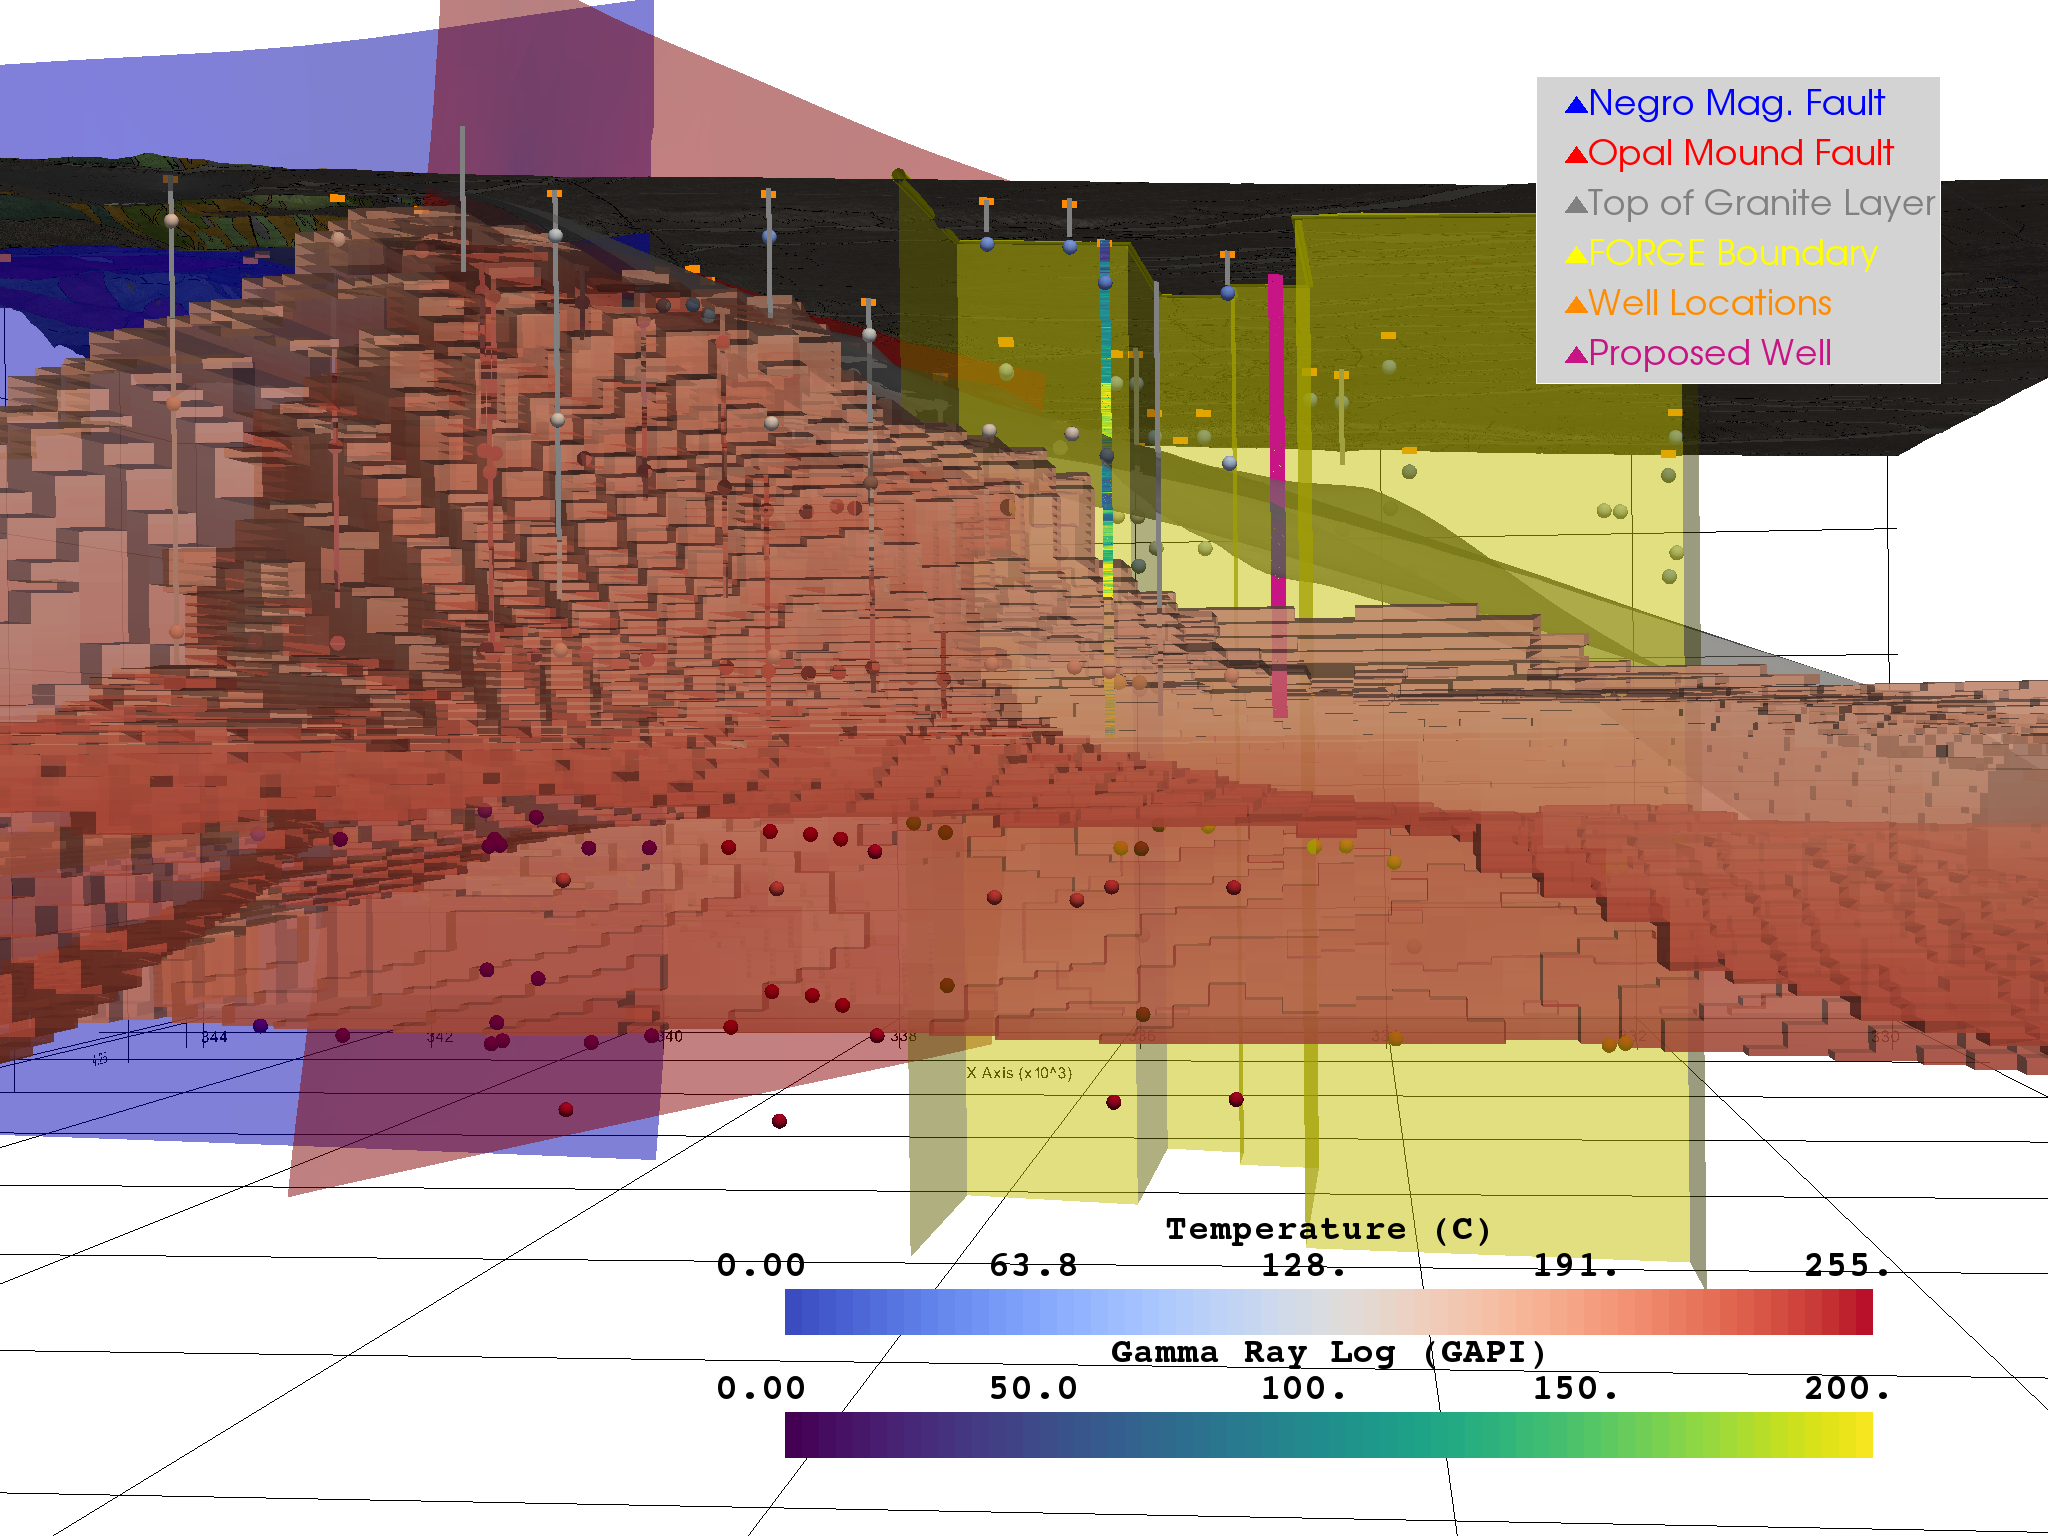
Figure 5
This figure shows a model of Milford Valley, Utah with topography, fault, granite, FORGE site and well, well logs, proposed well, temperature, and gravity locations and data
def fig_5(p, bounds=None):
    fig_4(p, bounds)
    add_grav_model(p, bounds)


p = pyvista.Plotter()
fig_5(p, ROI_BOX)
p.remove_actor('walls')
p.show_grid()
p.add_legend(bcolor=legend_color, border=True, )
p.camera_position = [(327252.94475250016, 4277460.796102717, -2027.954347716202),
 (335281.2562947662, 4260510.214867136, -486.54134488200475),
 (-0.036117608696067414, 0.07352368982670517, 0.996639245352271)]
p.show(auto_close=False)
# p.export_vtkjs(gdc19.EXPORT_PATH.format('figure-05'))
p.screenshot('figure-05.png')
p.close()
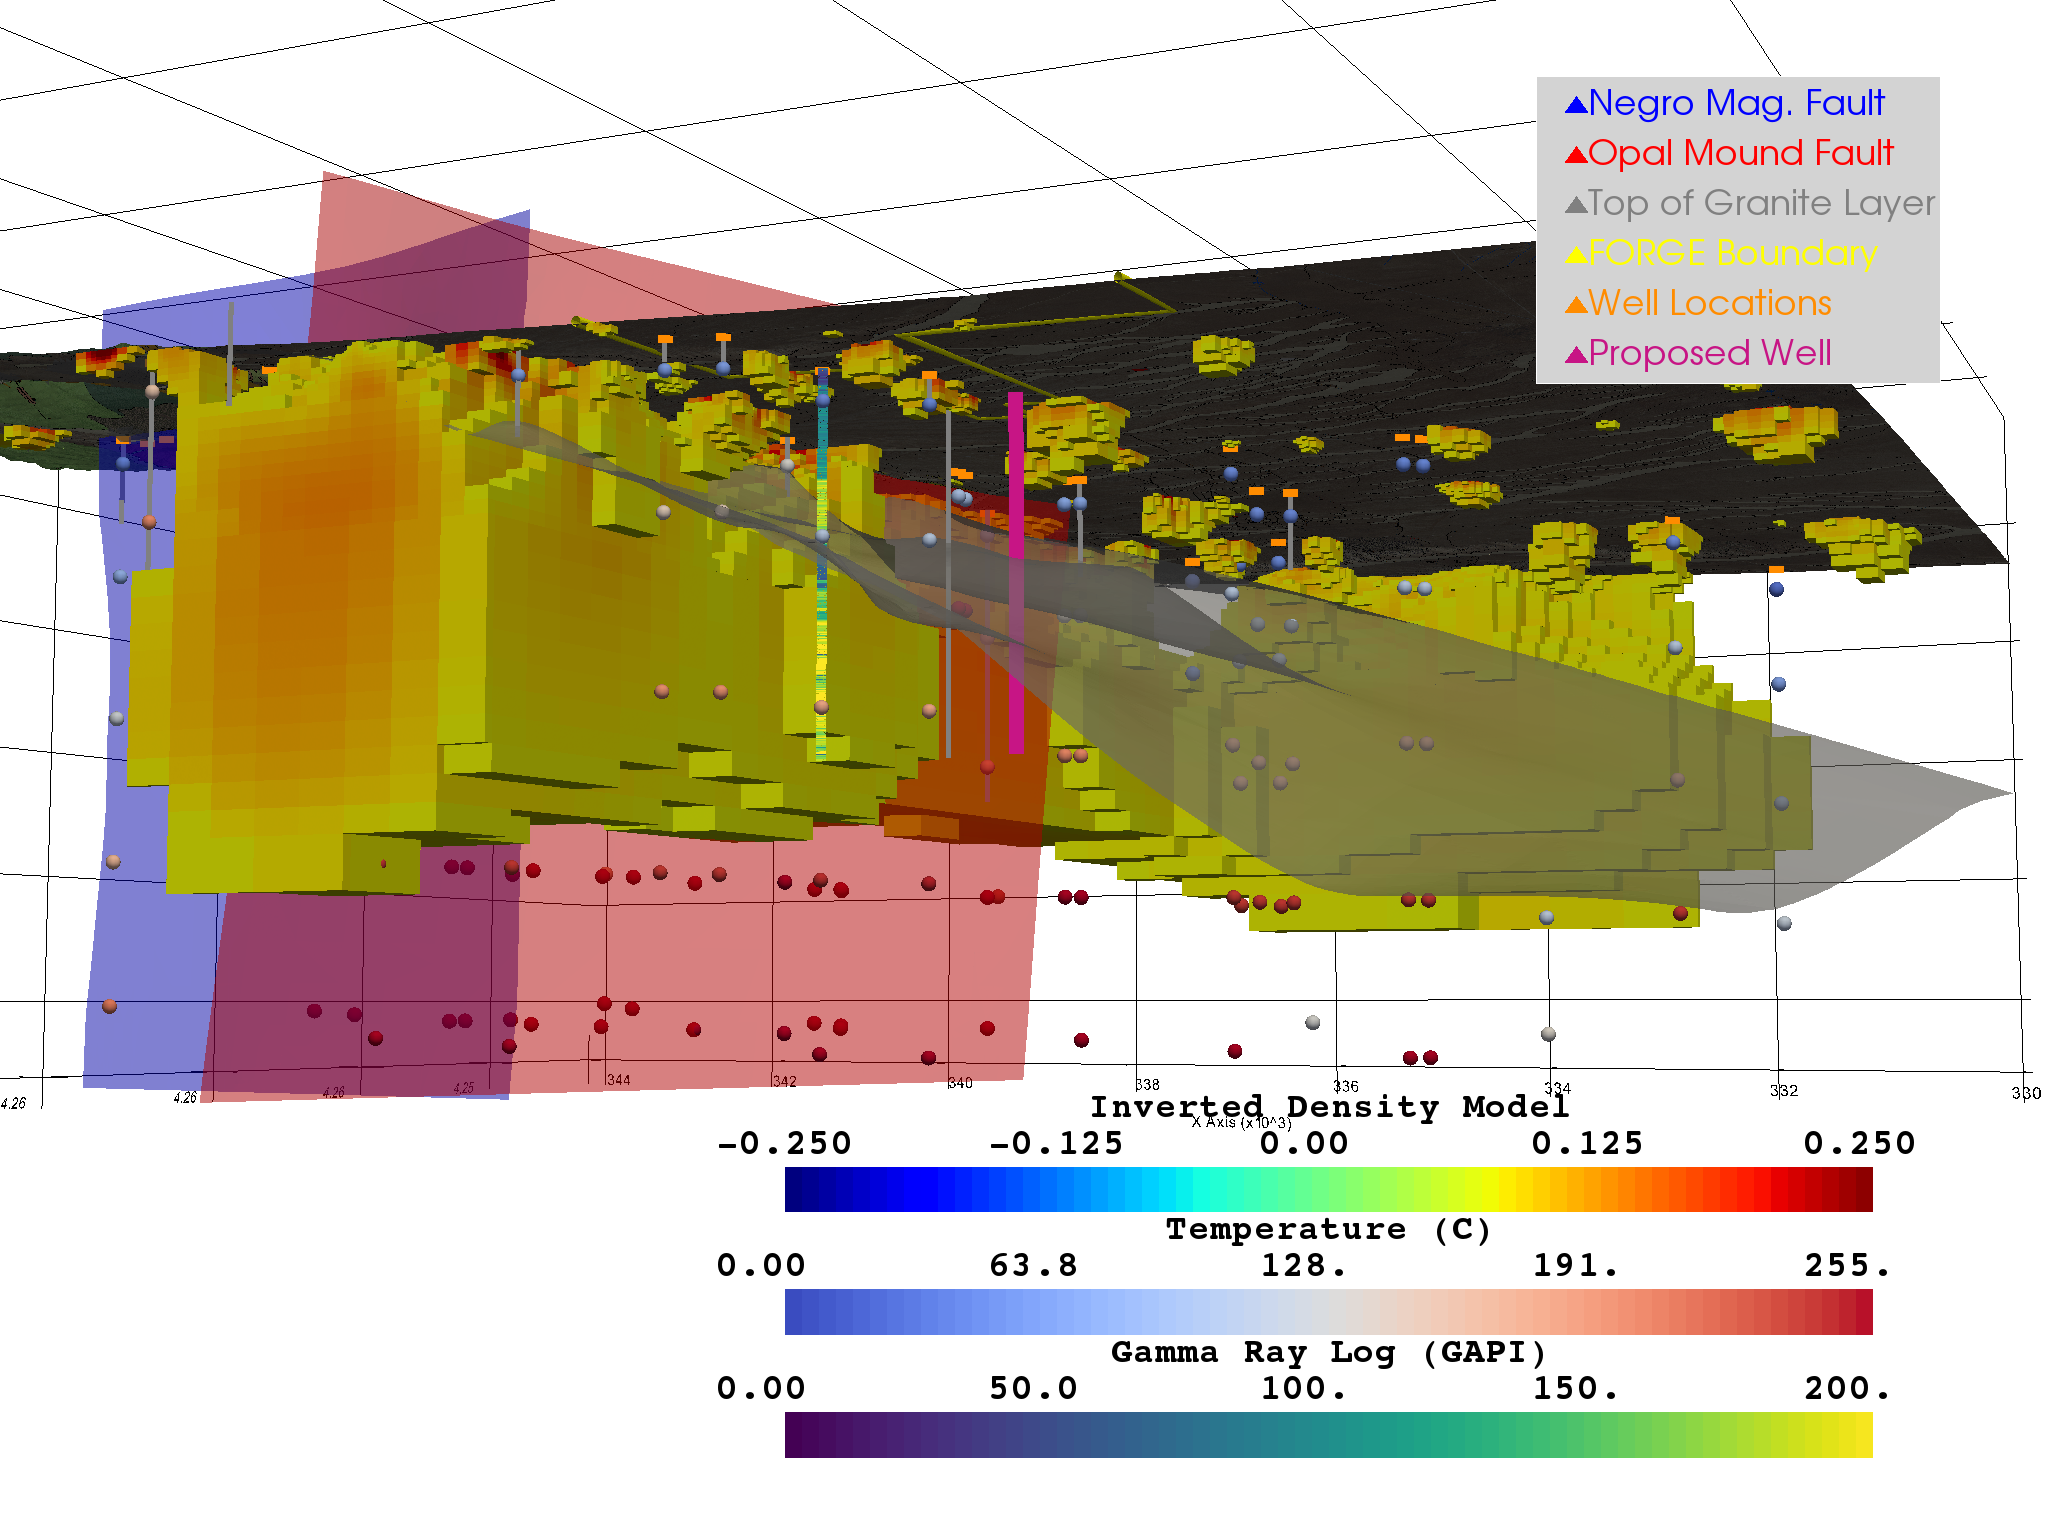
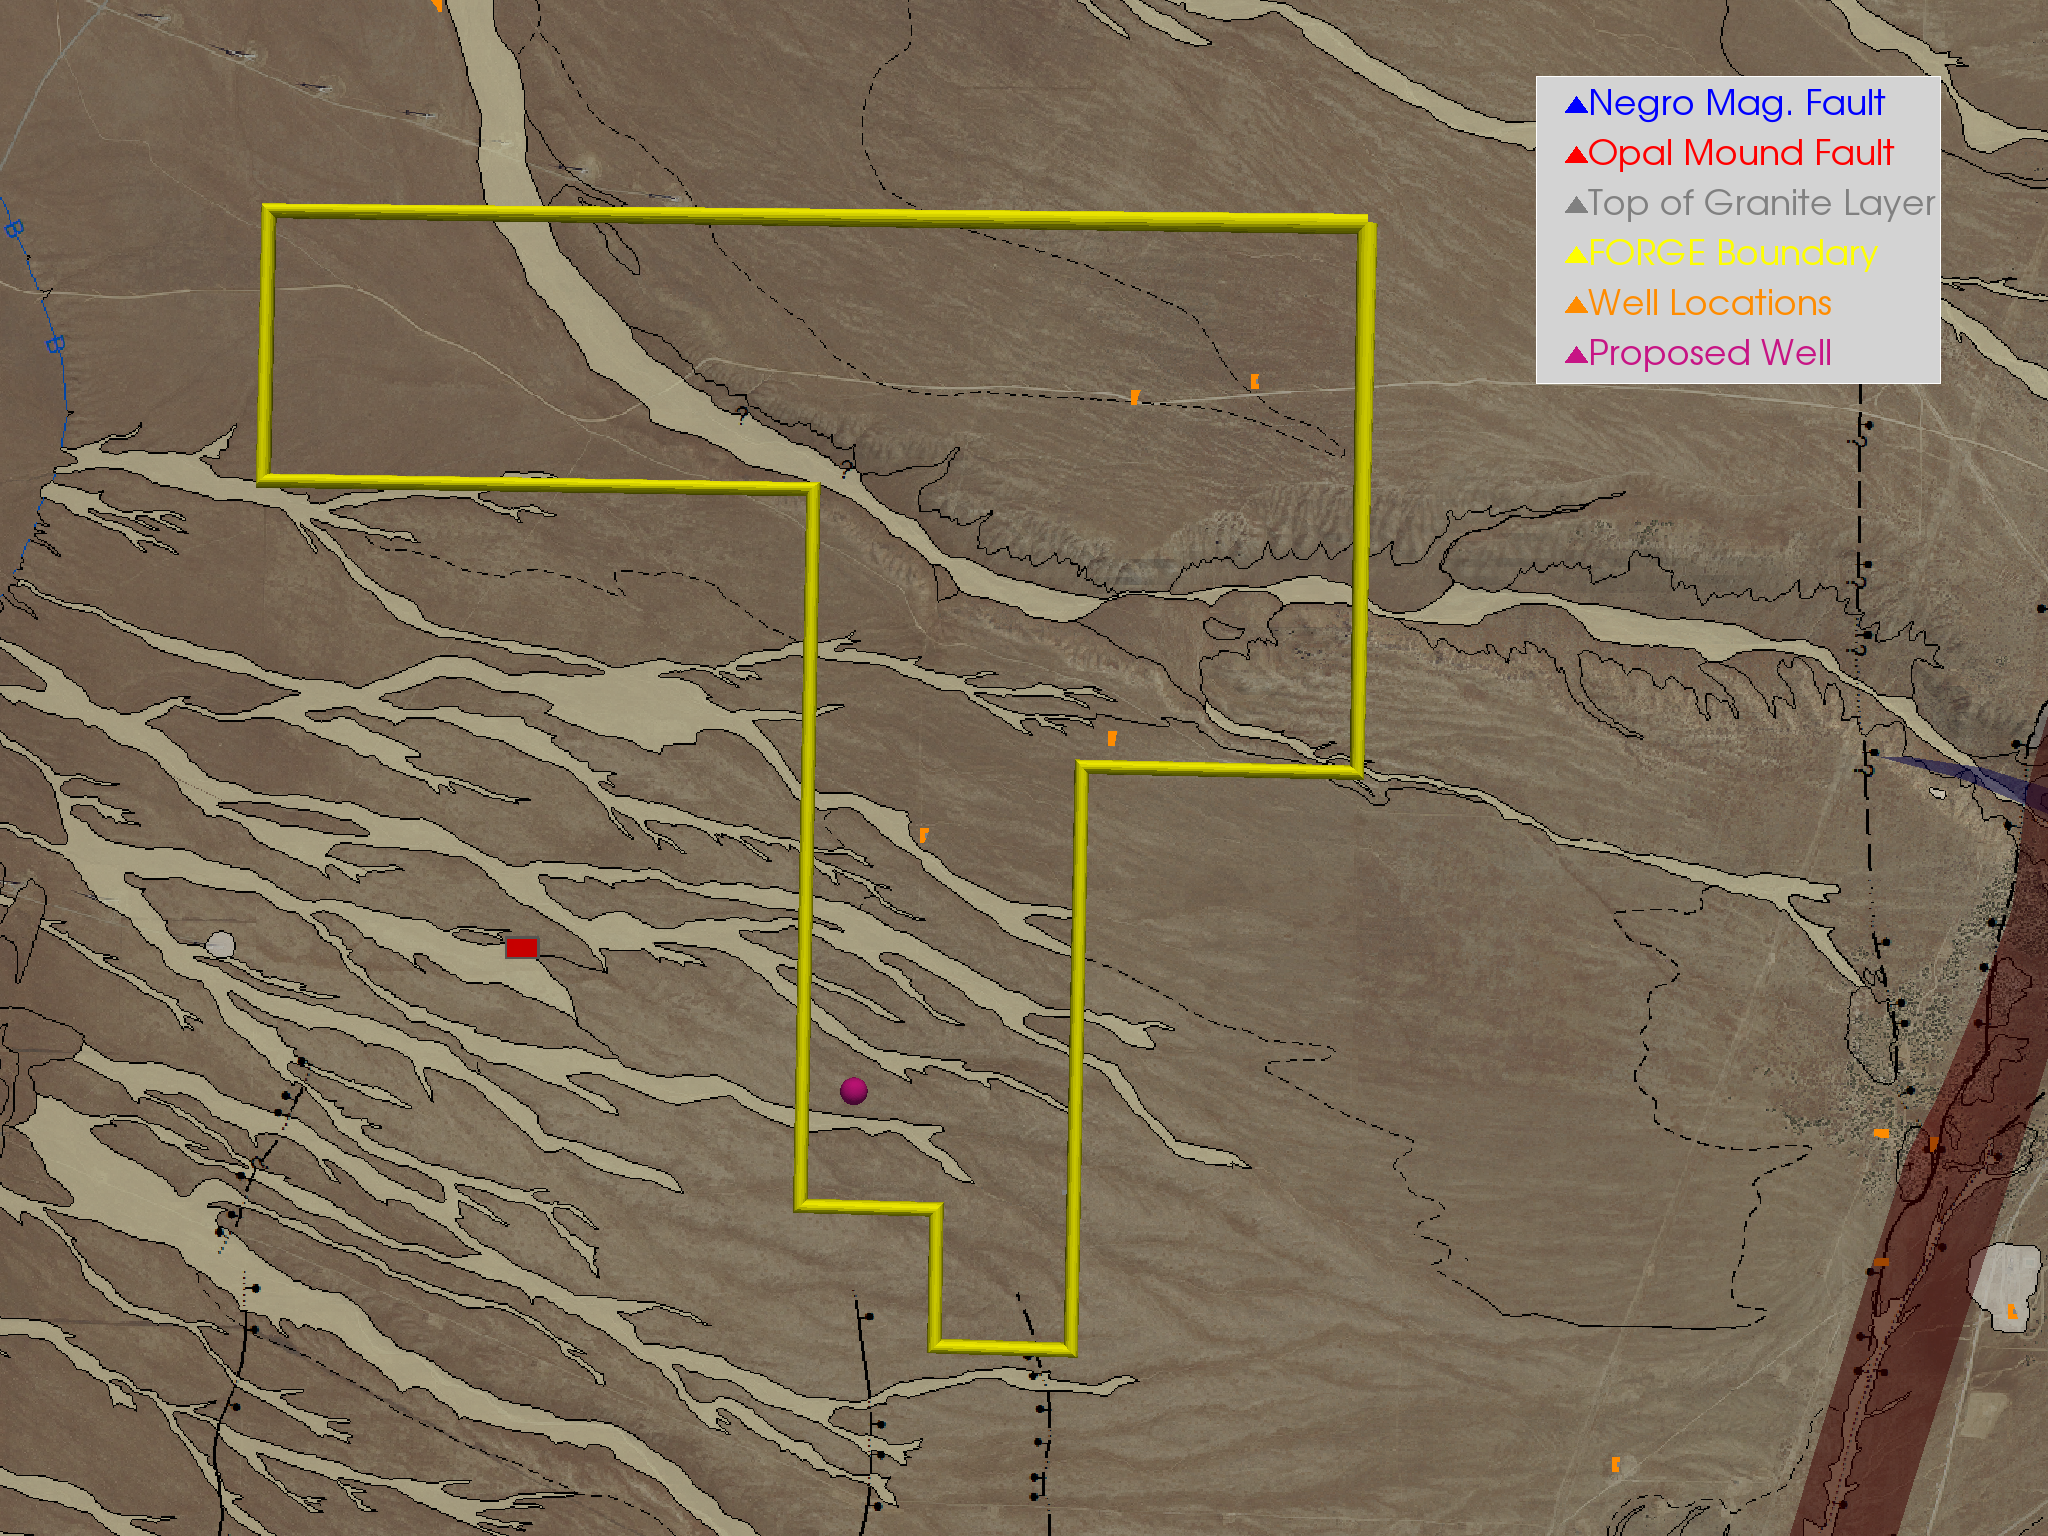
Figure 6
Show an aerial view of the proposed well’s location
p = pyvista.Plotter()
fig_1(p)

loc = proposed.points[0]
# add_well_traj_proposed(p)
loc[-1] = 1.8e3
s = pyvista.Sphere(radius=40, center=loc)
p.add_mesh(s, label='Proposed Well', color=WELL_COLOR)

p.camera_position = [(335111.21558935504, 4262955.412897479, 10111.108956611326),
                     (335111.21558935504, 4262955.412897479, 150.0),
                     (0.0, 1.0, 0.0)]
p.show_grid()

p.add_legend(bcolor=legend_color, border=True, )
cpos = p.show(auto_close=False)
# p.export_vtkjs(gdc19.EXPORT_PATH.format('figure-06'))
p.screenshot('figure-06.png')
p.close()
cpos
Total running time of the script: ( 1 minutes 1.413 seconds)